Daniocell
arhgap33 (taste / olfactory)
Rho GTPase activating protein 33
ZFIN
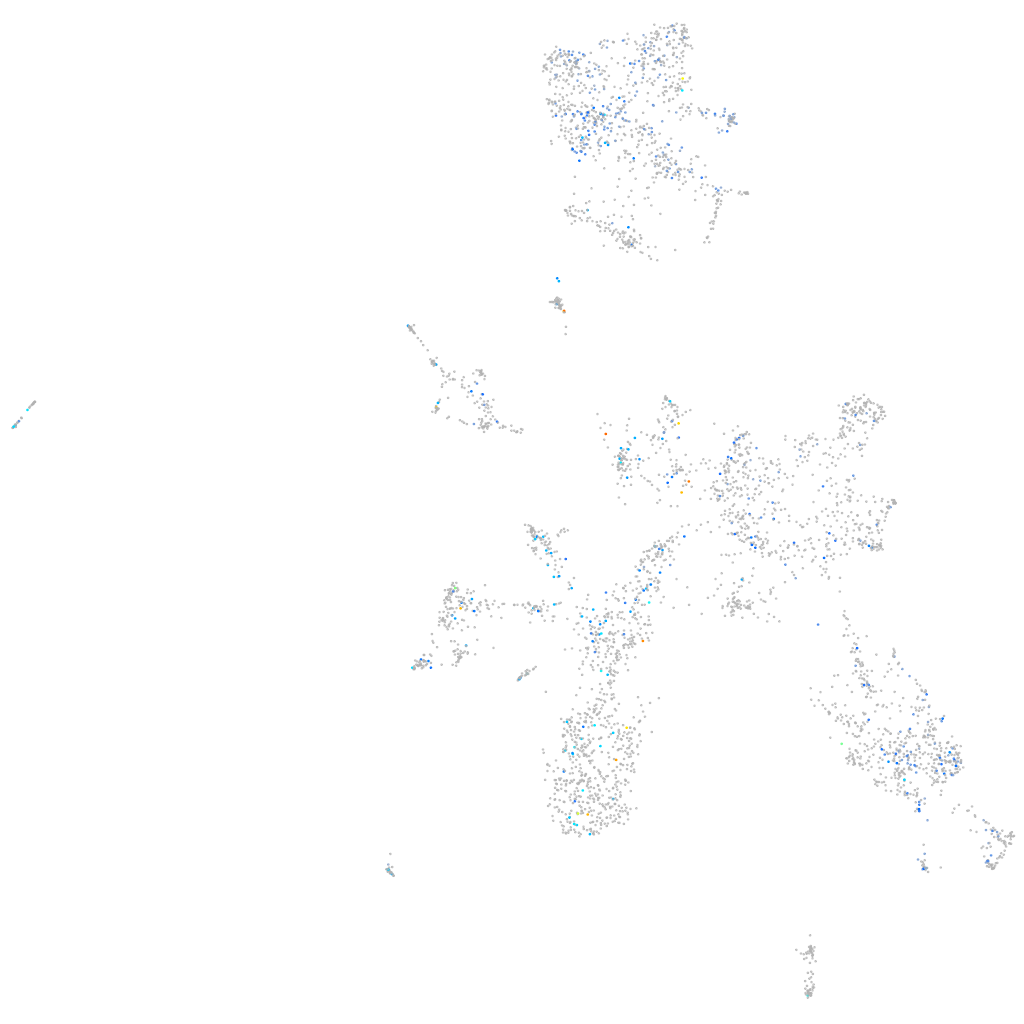
Gene expression UMAP
Display:
Expression
Stage
Other cell groups
all cells
blastomeres
PGCs
endoderm
axial mesoderm
muscle
mural cells /
non-skeletal muscle
mesenchyme
hematopoietic /
vasculature
pronephros
neural
spinal cord / glia
eye
taste / olfactory
otic / lateral line
epidermis
periderm
fin
ionocytes / mucous
pigment cells
Expression by stage/cluster
Correlated gene expression
Positive correlation
Negative correlation
Gene
r
Gene
r
LOC110439879
0.175
rps19
-0.086
ggt1b
0.166
rps14
-0.078
BX571952.1
0.159
rpl28
-0.076
LOC101885283
0.157
rpl36a
-0.074
cyth3b
0.153
rps23
-0.073
BX842701.1
0.147
rps26l
-0.071
XLOC-031737
0.147
rps28
-0.070
LOC100149554.1
0.145
rpl30
-0.068
spi1b
0.132
rps25
-0.067
si:dkey-241l7.4
0.130
rack1
-0.065
aplnrb
0.129
rps24
-0.061
si:ch211-223g7.6
0.129
si:dkey-261h17.1
-0.061
XLOC-043195
0.128
si:ch211-243g18.2
-0.059
si:ch211-1a19.2
0.127
rps11
-0.059
LOC100535033
0.124
rpl29
-0.059
CR932999.1
0.124
COX7A2 (1 of many)
-0.057
esm1
0.124
rps27a
-0.057
zgc:112265
0.121
tpm4a
-0.056
LOC110440005
0.120
sp8b
-0.055
cftr
0.119
faua
-0.055
glsa
0.118
rps4x
-0.055
tspan10
0.118
rpl22
-0.054
tph1b
0.116
dlgap5
-0.054
si:dkey-243k1.3
0.115
col14a1a
-0.053
zgc:113343
0.114
sp8a
-0.053
CT583708.1
0.113
nop10
-0.053
BX248118.1
0.112
rplp2l
-0.052
sec14l1
0.110
rpl10a
-0.052
pcdh2ab12
0.109
rpl31
-0.052
zgc:136908
0.109
nap1l1
-0.051
arhgap31
0.109
gas1a
-0.051
sos1
0.107
rps10
-0.051
XLOC-036686
0.106
rpl21
-0.051
cldnk
0.105
si:dkey-151g10.6
-0.051
pip5k1cb
0.105
rpl27
-0.051