Daniocell
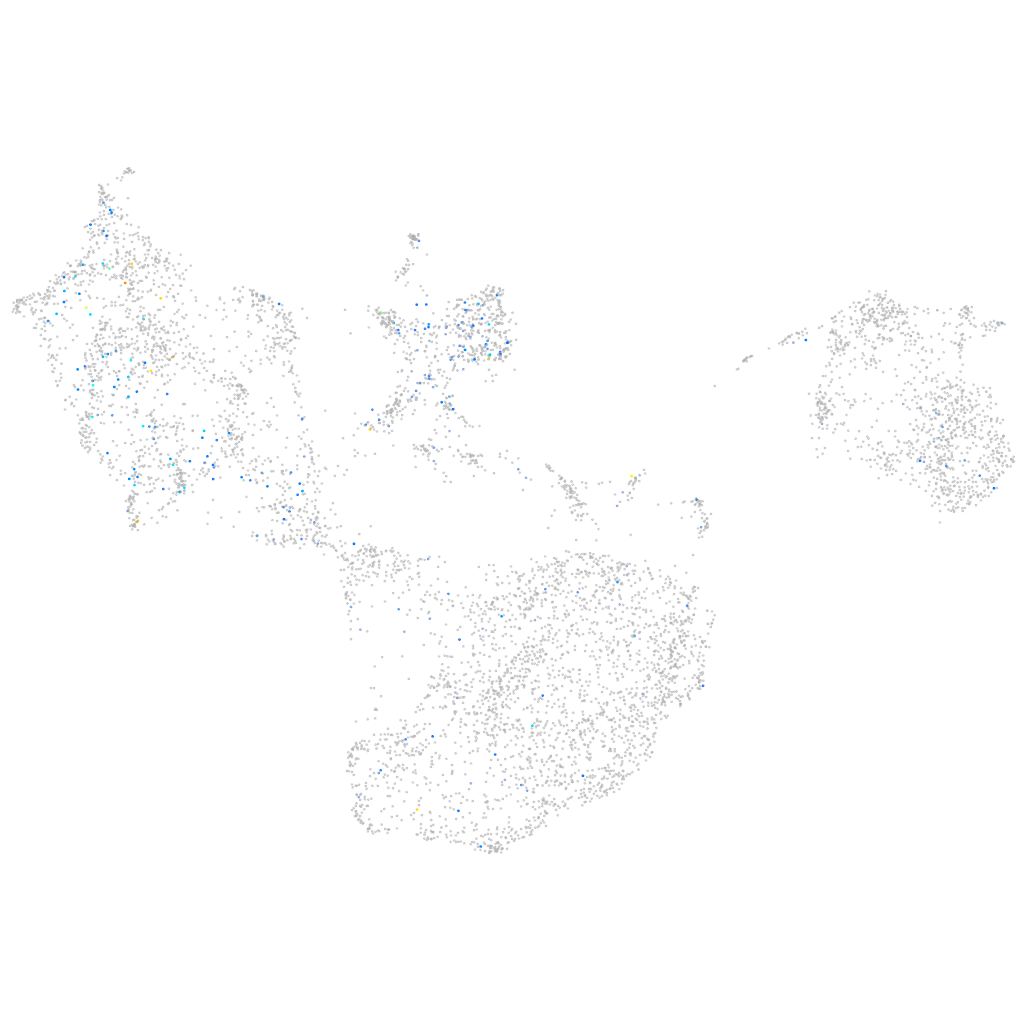
arhgap33 (fin)
Rho GTPase activating protein 33
ZFIN
Gene expression UMAP
Display:
Expression
Stage
Other cell groups
all cells
blastomeres
PGCs
endoderm
axial mesoderm
muscle
mural cells /
non-skeletal muscle
mesenchyme
hematopoietic /
vasculature
pronephros
neural
spinal cord / glia
eye
taste / olfactory
otic / lateral line
epidermis
periderm
fin
ionocytes / mucous
pigment cells
Expression by stage/cluster
Correlated gene expression
Positive correlation
Negative correlation
Gene
r
Gene
r
XLOC-036274
0.196
pfn1
-0.107
adgrd2
0.178
cldn1
-0.105
CR545476.1
0.171
cfl1l
-0.104
si:ch211-160o17.3
0.169
krt4
-0.101
BX927181.2
0.169
tmsb1
-0.101
LOC101885698
0.168
cldni
-0.100
CU915778.1
0.154
s100a10b
-0.100
LOC101884089
0.154
cyt1
-0.099
si:cabz01074946.1
0.152
epcam
-0.099
shank2
0.151
cotl1
-0.097
XLOC-019120
0.148
anxa1a
-0.096
CABZ01102201.1
0.146
spaca4l
-0.092
c3b.1
0.140
rbp4
-0.091
CABZ01087564.1
0.138
krt5
-0.088
wu:fc31d10
0.118
apoeb
-0.086
nkx2.2b
0.118
wu:fb18f06
-0.086
BX957328.1
0.117
si:dkey-248g15.3
-0.085
LOC101883668
0.117
cyt1l
-0.085
si:dkeyp-30e7.2
0.116
tagln2
-0.084
BX470116.1
0.114
rac2
-0.084
LOC101882691
0.112
hbegfa
-0.084
LOC569612
0.111
arhgdig
-0.083
crtac1b
0.111
col18a1a
-0.083
ap1m1
0.110
tmsb4x
-0.081
XLOC-001482
0.109
capns1a
-0.081
LOC564237
0.107
ecrg4b
-0.081
LOC108183929
0.106
thy1
-0.080
ceacam1
0.106
si:dkey-102c8.3
-0.080
gpc1a
0.106
pycard
-0.080
cd81a
0.105
cd9b
-0.079
LOC110438254
0.104
tmem238a
-0.079
znfl1b
0.104
zgc:175088
-0.078
mettl11b
0.103
arhgef5
-0.078
si:ch211-28p3.4
0.103
abracl
-0.078
CU633855.1
0.103
myh9a
-0.078