Daniocell
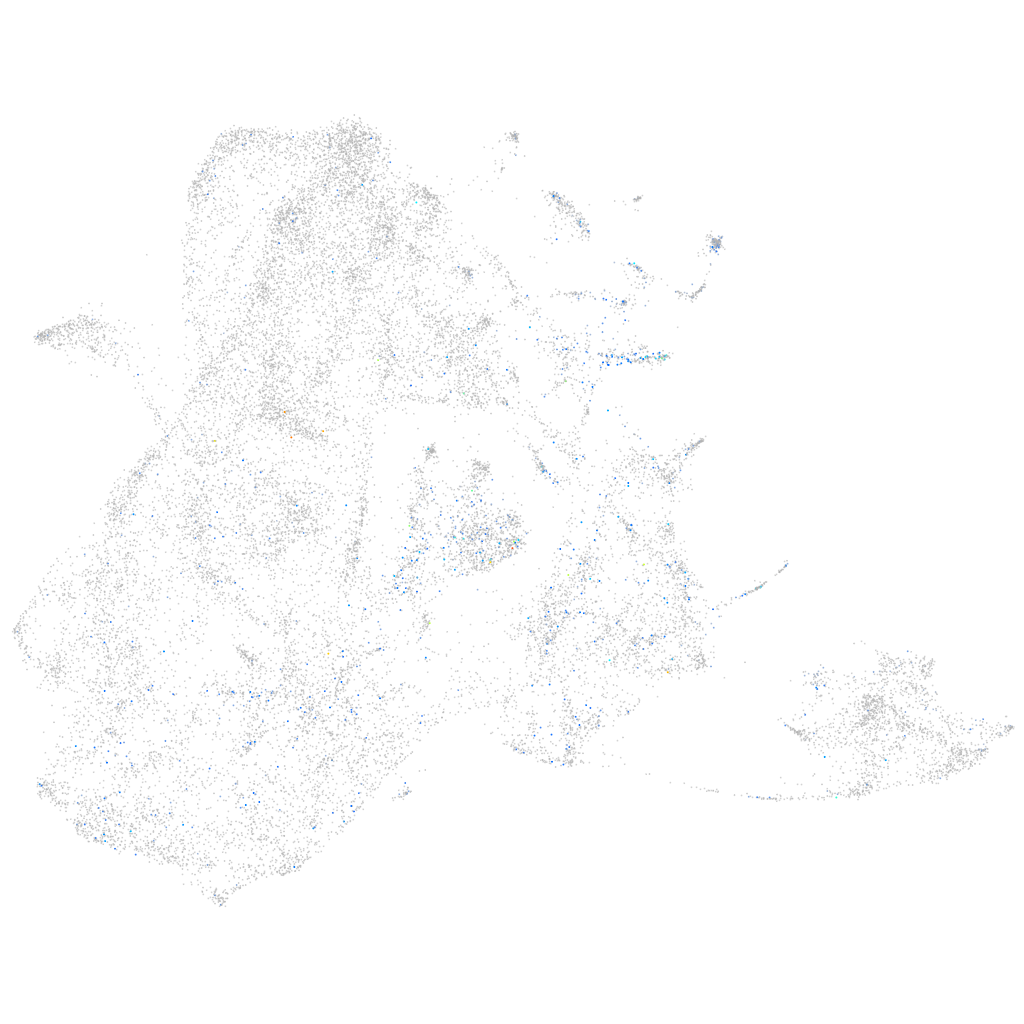
arhgap33 (epidermis)
Rho GTPase activating protein 33
ZFIN
Gene expression UMAP
Display:
Expression
Stage
Other cell groups
all cells
blastomeres
PGCs
endoderm
axial mesoderm
muscle
mural cells /
non-skeletal muscle
mesenchyme
hematopoietic /
vasculature
pronephros
neural
spinal cord / glia
eye
taste / olfactory
otic / lateral line
epidermis
periderm
fin
ionocytes / mucous
pigment cells
Expression by stage/cluster
Correlated gene expression
Positive correlation
Negative correlation
Gene
r
Gene
r
XLOC-043912
0.145
cyt1
-0.088
b4galnt1b
0.133
krt4
-0.086
cldnh
0.115
cfl1l
-0.082
alox5ap
0.112
cyt1l
-0.074
si:ch211-218d20.15
0.109
pfn1
-0.073
LOC108191590
0.107
s100a10b
-0.068
cul9
0.098
actb2
-0.065
sox8b
0.097
cldn1
-0.062
BX649608.1
0.097
spaca4l
-0.061
si:dkey-28d5.11
0.095
tmsb1
-0.061
abo
0.094
ecrg4b
-0.060
CR788249.1
0.093
zgc:175088
-0.060
rgs13
0.093
col1a2
-0.059
id2b
0.091
actb1
-0.058
bik
0.091
si:ch211-166a6.5
-0.058
si:ch211-285j22.3.1
0.090
anxa1a
-0.057
fscn1a
0.090
postnb
-0.057
grap2b
0.089
zgc:86896
-0.056
XLOC-000439
0.088
col2a1b
-0.056
LOC108190371
0.088
col11a1a
-0.055
pou2f3
0.087
col1a1a
-0.054
si:ch1073-209h18.1
0.086
krt5
-0.054
ak5
0.085
thy1
-0.054
mir375-2
0.085
si:dkey-16p21.8
-0.053
marcksl1a
0.083
krtt1c19e
-0.053
ckbb
0.083
pleca
-0.053
XLOC-044244
0.083
col1a1b
-0.053
LOC100002960
0.083
cap1
-0.052
inpp5d
0.082
myl12.1
-0.051
CT737184.2
0.081
tuba8l2
-0.051
LOC101885828
0.080
rbp4
-0.050
LOC110439637
0.080
sparc
-0.050
LO017656.1
0.080
zgc:101810
-0.050
rbm38
0.080
capns1a
-0.050
LOC101884879
0.080
lgals3b
-0.050