Daniocell
arhgap33 (pigment cells)
Rho GTPase activating protein 33
ZFIN
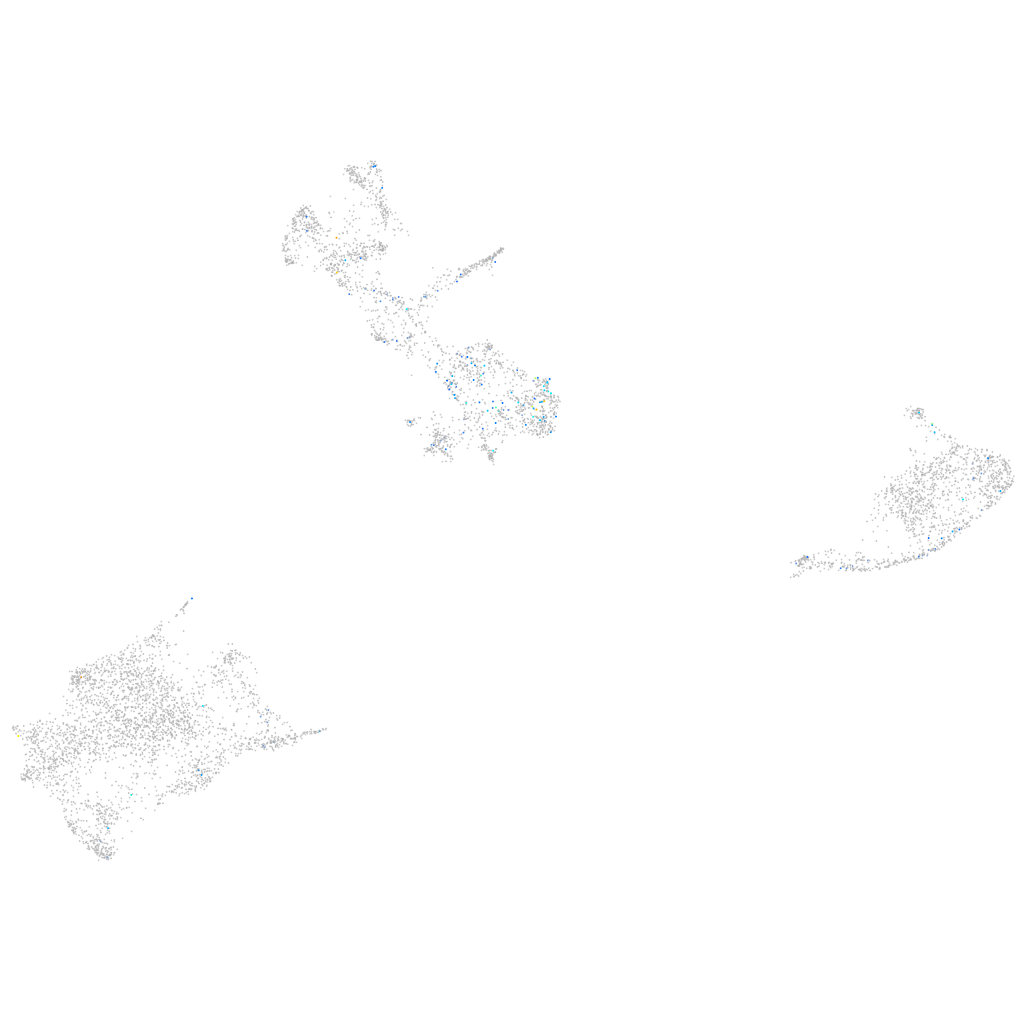
Gene expression UMAP
Display:
Expression
Stage
Other cell groups
all cells
blastomeres
PGCs
endoderm
axial mesoderm
muscle
mural cells /
non-skeletal muscle
mesenchyme
hematopoietic /
vasculature
pronephros
neural
spinal cord / glia
eye
taste / olfactory
otic / lateral line
epidermis
periderm
fin
ionocytes / mucous
pigment cells
Expression by stage/cluster
Correlated gene expression
Positive correlation
Negative correlation
Gene
r
Gene
r
si:dkeyp-97a10.2
0.205
uraha
-0.069
LOC101886825
0.184
gstp1
-0.067
si:busm1-194e12.8
0.181
slc22a7a
-0.065
zgc:171731
0.180
gch2
-0.065
FO704758.1
0.169
akr1b1
-0.062
drd5a
0.167
pts
-0.059
CU550719.1
0.158
si:dkey-251i10.2
-0.057
si:ch211-161m3.1
0.150
zgc:110339
-0.057
CU138553.1
0.150
actb2
-0.055
si:ch211-125e6.8
0.150
paics
-0.052
si:zfos-375h5.1
0.147
tmem130
-0.051
c3a.5
0.145
aldob
-0.050
BX936364.1
0.143
CABZ01021592.1
-0.050
ikzf1
0.138
mdh1aa
-0.048
si:dkeyp-75b4.7
0.138
krt18b
-0.048
FO834800.1
0.133
slc2a15a
-0.047
ackr4a
0.133
pttg1ipb
-0.046
hpn
0.131
si:ch211-251b21.1
-0.046
si:ch211-161m3.2
0.130
gpd1b
-0.045
hmgb1b
0.129
ppat
-0.045
XLOC-026746
0.127
tspan36
-0.045
chd4a
0.126
aox5
-0.045
LOC101884357
0.124
bscl2l
-0.045
ahi1
0.124
prdx5
-0.043
rgs13
0.124
C12orf75
-0.042
zgc:194007
0.123
fbp1a
-0.042
LOC110438136
0.123
slc2a11b
-0.041
ptmaa
0.123
gpr143
-0.041
pax6a
0.123
pcbd1
-0.041
si:dkey-31c13.1
0.120
CABZ01032488.1
-0.041
ptf1a
0.120
glulb
-0.040
syt14a
0.120
impdh1b
-0.040
cadm3
0.120
prdx1
-0.040
runx2a
0.119
cd164
-0.039
wnt10b
0.118
sprb
-0.039