Daniocell
arhgap33 (axial mesoderm)
Rho GTPase activating protein 33
ZFIN
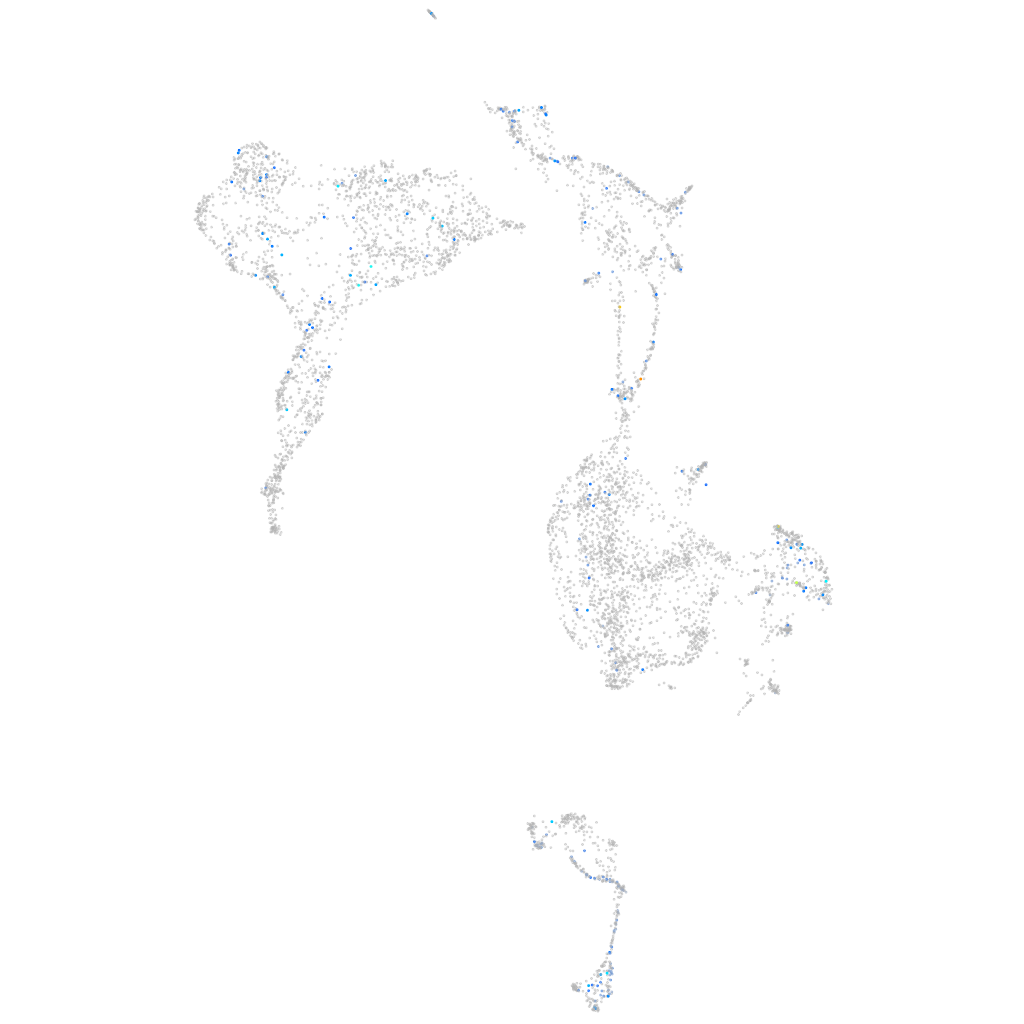
Gene expression UMAP
Display:
Expression
Stage
Other cell groups
all cells
blastomeres
PGCs
endoderm
axial mesoderm
muscle
mural cells /
non-skeletal muscle
mesenchyme
hematopoietic /
vasculature
pronephros
neural
spinal cord / glia
eye
taste / olfactory
otic / lateral line
epidermis
periderm
fin
ionocytes / mucous
pigment cells
Expression by stage/cluster
Correlated gene expression
Positive correlation
Negative correlation
Gene
r
Gene
r
si:dkey-27l15.1
0.257
matn3a
-0.070
XLOC-043742
0.256
ucmab
-0.069
moto
0.212
epyc
-0.068
BX569779.1
0.208
rgcc
-0.065
cx39.9
0.199
col11a1a
-0.064
lgi3
0.199
krt5
-0.063
LOC103909053
0.199
cnmd
-0.062
il17a/f2
0.198
col11a2
-0.062
LOC110438054
0.198
shha
-0.062
gabra3
0.187
si:dkey-31g6.6
-0.061
fam57bb
0.185
col9a2
-0.060
grin3ba
0.185
si:ch73-23l24.1
-0.060
hivep2b
0.182
zmp:0000000760
-0.060
LOC101882015
0.180
col9a1b
-0.059
KCNN2
0.176
selenom
-0.059
vwc2
0.169
col2a1a
-0.058
drd2a
0.168
cmn
-0.057
lgals8b
0.167
zgc:113232
-0.057
fgl2a
0.163
col9a3
-0.057
fosl1b
0.158
sdc2
-0.055
si:dkey-35i13.1
0.155
nid1a
-0.055
cluhb
0.152
gstt1a
-0.054
si:ch73-116o1.2
0.152
si:dkey-6n6.1
-0.054
ccdc85al
0.150
col8a1a
-0.053
BX324146.1
0.149
chad
-0.053
LOC101884552
0.146
krt18a.1
-0.052
CR407594.1
0.142
crtap
-0.052
si:ch73-194h10.2
0.141
haus7
-0.052
LOC103909602
0.137
krt94
-0.052
LOC100004160
0.136
kdelr2a
-0.051
cdh26.2
0.136
si:dkey-1j5.4
-0.050
zgc:113442
0.134
fam198a
-0.050
plppr3b
0.134
ppib
-0.050
si:ch211-147g22.7
0.133
si:dkey-234i14.3
-0.050
GPR45
0.133
serpinh1b
-0.049