Daniocell
arhgap33 (blastomeres)
Rho GTPase activating protein 33
ZFIN
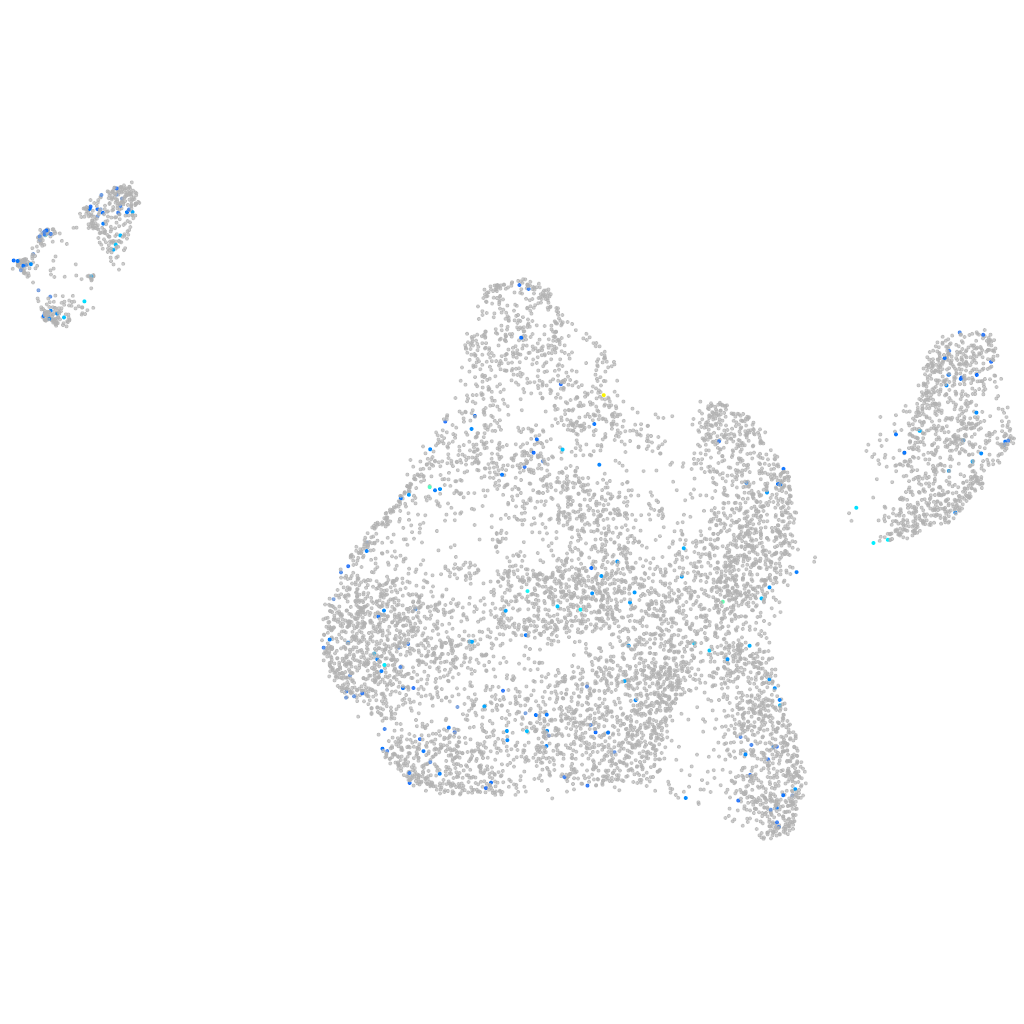
Gene expression UMAP
Display:
Expression
Stage
Other cell groups
all cells
blastomeres
PGCs
endoderm
axial mesoderm
muscle
mural cells /
non-skeletal muscle
mesenchyme
hematopoietic /
vasculature
pronephros
neural
spinal cord / glia
eye
taste / olfactory
otic / lateral line
epidermis
periderm
fin
ionocytes / mucous
pigment cells
Expression by stage/cluster
Correlated gene expression
Positive correlation
Negative correlation
Gene
r
Gene
r
slc6a6a
0.163
marcksl1b
-0.083
CABZ01078767.1
0.146
si:dkey-151g10.6
-0.081
drd6b
0.110
si:ch73-1a9.3
-0.079
en2b
0.106
stm
-0.075
tac4
0.099
hnrnpa0b
-0.074
si:ch73-27e22.2
0.092
aldob
-0.071
LO018568.1
0.092
rplp1
-0.070
LOC100007229
0.090
si:ch211-152c2.3
-0.067
slmapb
0.089
hmgn6
-0.067
LOC101883229
0.089
eef1a1l1
-0.065
hbae1.3
0.089
rpl36
-0.064
CABZ01088049.1
0.086
hspb1
-0.064
tradv41.0
0.086
apoeb
-0.063
prf1.5
0.085
rps20
-0.063
LOC101882750
0.085
hmga1a
-0.061
si:ch1073-90m23.1
0.085
rps26l
-0.060
mpp7a
0.084
polr3gla
-0.060
mid1ip1l
0.084
si:ch211-222l21.1
-0.058
XLOC-026037
0.084
cirbpb
-0.056
XLOC-002952
0.083
dynll1
-0.055
XLOC-010593
0.083
rpl32
-0.055
CABZ01053221.1
0.081
rps15
-0.054
myo1f
0.081
ptmab
-0.054
smyd2a
0.081
rps12
-0.053
slc25a25a
0.080
rps4x
-0.053
dnajb13
0.079
ptges3b
-0.053
CR847563.2
0.078
si:ch1073-80i24.3
-0.052
LOC100537963
0.077
rpl22
-0.052
LOC108182795
0.077
rpl7a
-0.052
satb2
0.077
rps29
-0.051
LOC101886102
0.076
hmgb2a
-0.051
h2af1al
0.076
rplp0
-0.050
si:ch73-27e22.3
0.076
rps5
-0.050
si:ch211-51f19.1
0.075
hmgn7
-0.050
MAPK8IP1
0.075
rps21
-0.049