Daniocell
tube1 (pronephros)
"tubulin, epsilon 1"
ZFIN
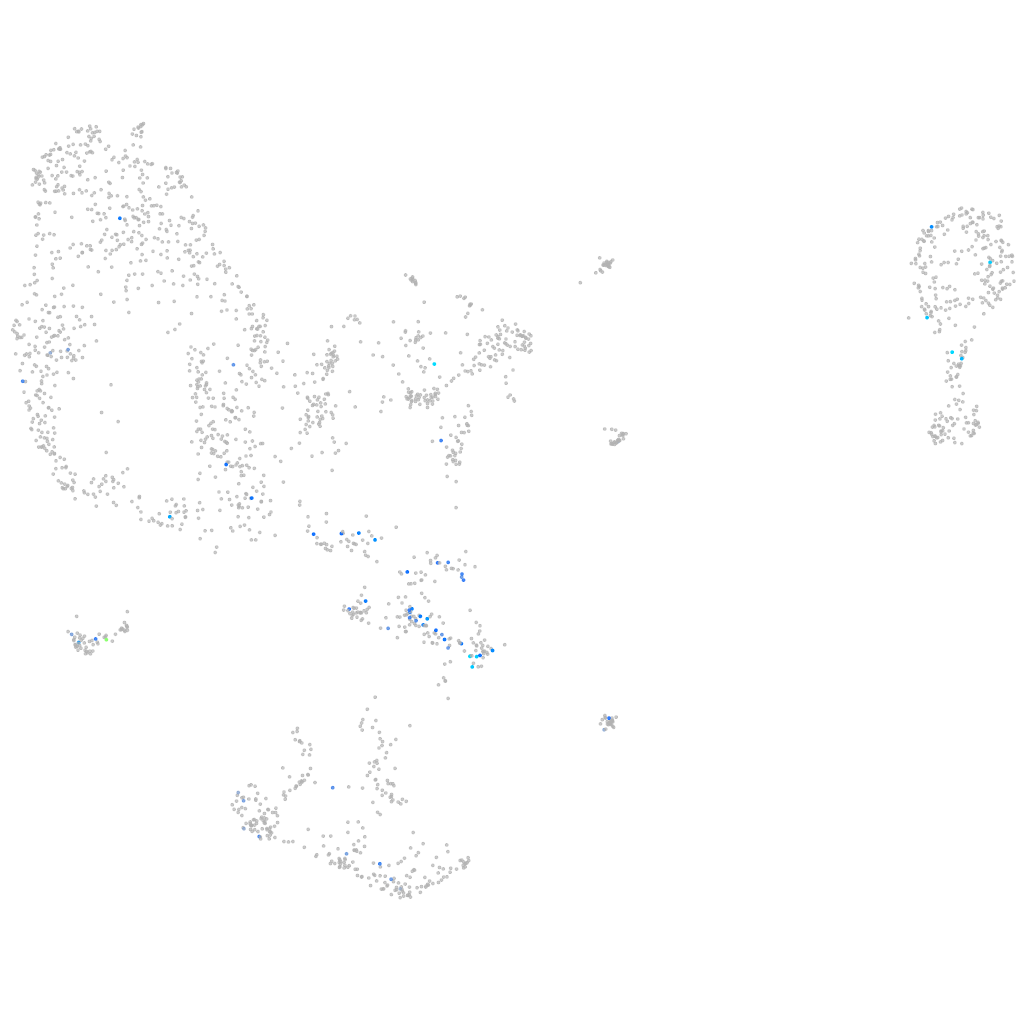
Gene expression UMAP
Display:
Expression
Stage
Other cell groups
all cells
blastomeres
PGCs
endoderm
axial mesoderm
muscle
mural cells /
non-skeletal muscle
mesenchyme
hematopoietic /
vasculature
pronephros
neural
spinal cord / glia
eye
taste / olfactory
otic / lateral line
epidermis
periderm
fin
ionocytes / mucous
pigment cells
Expression by stage/cluster
Correlated gene expression
Positive correlation
Negative correlation
Gene
r
Gene
r
si:dkey-27n6.1
0.292
si:ch211-139a5.9
-0.138
tmem86b
0.286
aldob
-0.114
gphb5
0.283
ldhba
-0.110
LOC108183297
0.273
gapdh
-0.108
ccka
0.270
aldh6a1
-0.108
si:dkey-152b24.7
0.266
grhprb
-0.107
LOC110439381
0.235
pdzk1ip1
-0.105
slc43a3a
0.230
si:dkey-16p21.8
-0.103
BX088525.2
0.229
glud1b
-0.100
si:dkey-256e7.5
0.229
upb1
-0.100
CU633933.1
0.217
gamt
-0.099
AL935198.1
0.217
hao1
-0.096
gabra2a
0.216
mdh1aa
-0.096
si:dkeyp-28d2.4
0.216
eno3
-0.095
si:rp71-45g20.11
0.216
nit2
-0.095
hoxa13b
0.213
gcshb
-0.095
XLOC-024151
0.211
si:dkey-194e6.1
-0.093
rpp25a
0.209
fbp1b
-0.093
LOC100535525
0.209
pnp6
-0.092
AL954142.2
0.207
dab2
-0.091
BX293559.1
0.207
dpys
-0.091
CABZ01056275.1
0.207
gstt1a
-0.091
kcnj14
0.207
cubn
-0.090
LOC110438093
0.207
pklr
-0.089
TSTA3
0.207
si:dkey-33i11.9
-0.089
hhat
0.207
gstr
-0.088
LOC110440053
0.207
zgc:136493
-0.088
hpxa
0.206
elovl1b
-0.088
BX294165.1
0.204
pdzk1
-0.088
cldn15la
0.202
zgc:103678
-0.087
fbln1
0.194
ftcd
-0.086
entpd2a.1
0.193
sord
-0.086
LOC108180103
0.192
alpl
-0.086
plac8.1
0.192
phyhd1
-0.086
XLOC-019696
0.191
dera
-0.086