Daniocell
tube1 (blastomeres)
"tubulin, epsilon 1"
ZFIN
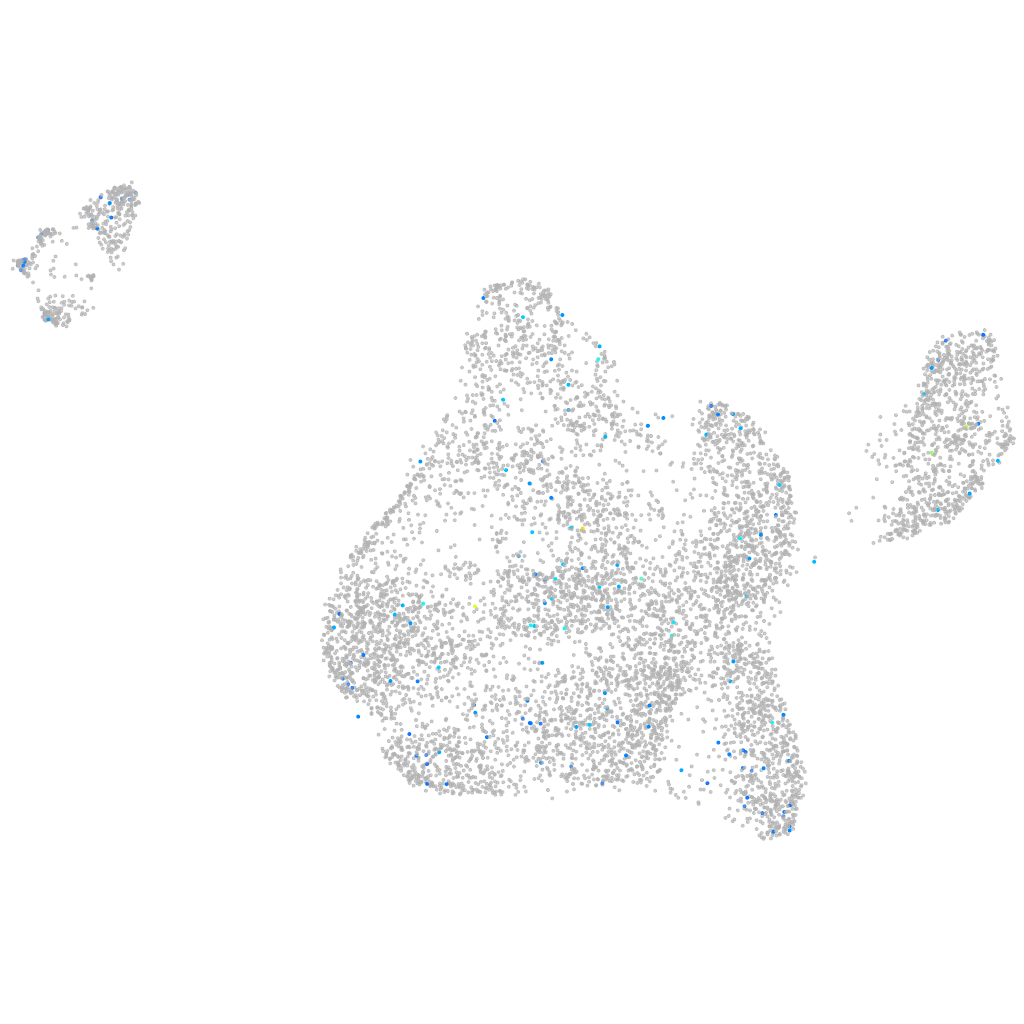
Gene expression UMAP
Display:
Expression
Stage
Other cell groups
all cells
blastomeres
PGCs
endoderm
axial mesoderm
muscle
mural cells /
non-skeletal muscle
mesenchyme
hematopoietic /
vasculature
pronephros
neural
spinal cord / glia
eye
taste / olfactory
otic / lateral line
epidermis
periderm
fin
ionocytes / mucous
pigment cells
Expression by stage/cluster
Correlated gene expression
Positive correlation
Negative correlation
Gene
r
Gene
r
LOC101885053
0.176
khsrp
-0.034
tnfsf11
0.157
NC-002333.4
-0.034
tyrobp
0.153
gnb1b
-0.033
ca14
0.131
syap1
-0.033
XLOC-017564
0.130
b4galt6
-0.029
CR753876.1
0.120
tent5ba
-0.028
XLOC-002238
0.113
map2k2a
-0.027
BX323022.1
0.111
cdc26
-0.027
LOC110438179
0.110
BX914200.1
-0.025
vtcn1
0.109
cth
-0.025
si:dkey-17m8.2
0.108
si:dkeyp-121d4.3
-0.025
ctslb
0.108
atp1b3a
-0.025
LOC101884520
0.108
fgf24
-0.024
CABZ01087025.3
0.107
yes1
-0.024
LOC110437844
0.106
pi4kb
-0.023
LOC103911600
0.104
kdelc2
-0.023
CR450777.1
0.103
khdrbs1a
-0.023
pdzrn3a
0.103
arrdc3a
-0.023
CABZ01084501.3
0.101
rps6kb1b
-0.023
crygm2d20
0.101
prelid1a
-0.022
BX682558.1
0.099
selenon
-0.022
XLOC-007275
0.098
ctsla
-0.022
CR847944.2
0.095
actl6a
-0.022
CABZ01102201.1
0.095
sdc4
-0.022
XLOC-033378
0.092
yaf2
-0.022
si:ch211-207l14.1
0.092
ppiab
-0.022
LOC101884668
0.090
XLOC-032706
-0.022
slc22a4
0.089
dpm3
-0.021
otol1a
0.088
agpat2
-0.021
si:dkey-7i4.11
0.087
zgc:92873
-0.021
CR974475.1
0.087
fgfr1op2
-0.021
si:dkey-112a7.5
0.086
polr2a
-0.021
si:dkey-13m1.2
0.086
dhcr7
-0.021
XLOC-006827
0.086
osr1
-0.021
epas1a
0.086
tpi1b
-0.021