Daniocell
tube1 (mural cells / non-skeletal muscle)
"tubulin, epsilon 1"
ZFIN
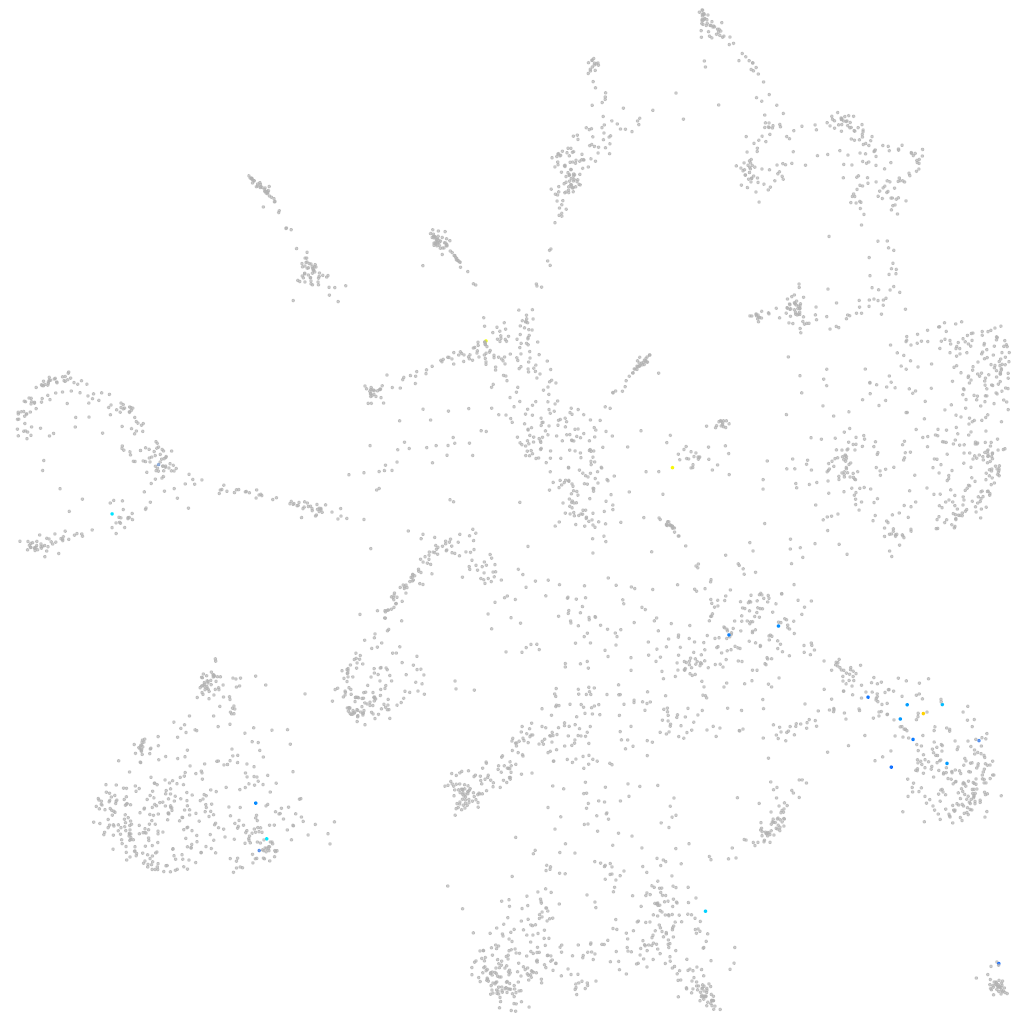
Gene expression UMAP
Display:
Expression
Stage
Other cell groups
all cells
blastomeres
PGCs
endoderm
axial mesoderm
muscle
mural cells /
non-skeletal muscle
mesenchyme
hematopoietic /
vasculature
pronephros
neural
spinal cord / glia
eye
taste / olfactory
otic / lateral line
epidermis
periderm
fin
ionocytes / mucous
pigment cells
Expression by stage/cluster
Correlated gene expression
Positive correlation
Negative correlation
Gene
r
Gene
r
LOC101883766
0.339
tmsb4x
-0.066
LOC100148254
0.324
tagln2
-0.048
hhla2b.1
0.317
si:dkey-7j14.6
-0.042
si:ch211-241j8.2
0.276
cnn2
-0.039
soga3
0.267
arpc3
-0.036
XLOC-021234
0.234
krt8
-0.036
XLOC-007007
0.227
col1a1a
-0.034
XLOC-031211
0.205
akap12b
-0.034
zgc:103564
0.204
dap1b
-0.034
znf1050
0.200
nptna
-0.032
c8g
0.190
sept7a
-0.032
BX284666.3
0.190
anxa5b
-0.032
FP009765.1
0.190
ppdpfb
-0.032
LOC110438136
0.188
ISCU (1 of many)
-0.032
cdan1
0.186
itga1
-0.031
CR376821.1
0.185
sult1st1
-0.031
si:dkey-217f16.6
0.185
krt18b
-0.031
AL954359.1
0.185
zgc:153704
-0.031
pi4kab
0.178
atp5if1b
-0.030
agbl2
0.172
LOC101884451
-0.030
kctd20
0.169
acta2
-0.030
dre-let-7b
0.164
mt-nd2
-0.030
LOC110439916
0.164
ccnd2a
-0.030
cyp26c1
0.162
ahnak
-0.030
smc2
0.161
krt94
-0.030
sgo1
0.157
capns1b
-0.030
si:dkeyp-104f11.9
0.157
LOC110439372
-0.029
cyp2r1
0.157
myl9a
-0.029
LOC110438510
0.153
kdelr2a
-0.029
ccnb2
0.153
timp2a
-0.029
tspan35
0.150
b2ml
-0.029
c6ast1
0.147
tns1b
-0.029
fam83d
0.146
krt15
-0.029
BX950188.1
0.146
vapb
-0.029
LOC110438511
0.144
bhmt
-0.029