Daniocell
tube1 (ionocytes / mucous-producing)
"tubulin, epsilon 1"
ZFIN
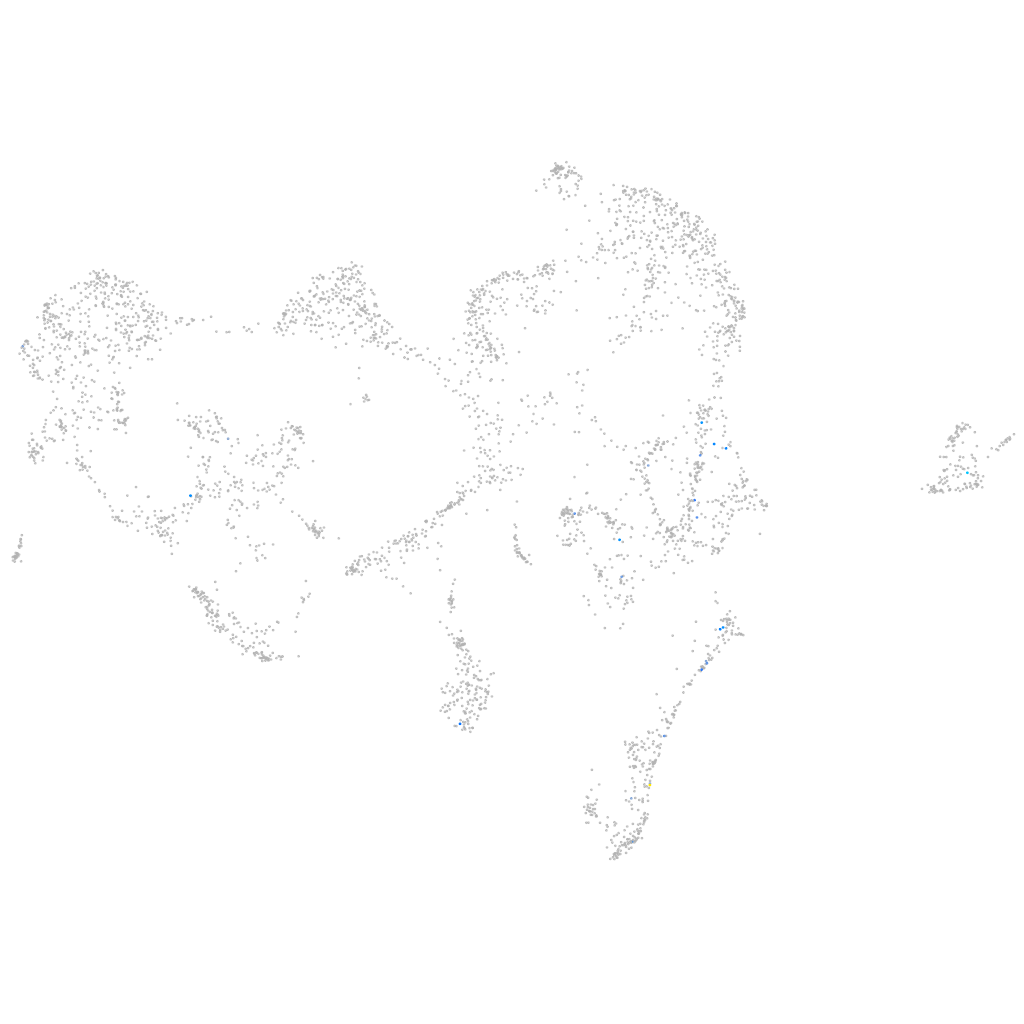
Gene expression UMAP
Display:
Expression
Stage
Other cell groups
all cells
blastomeres
PGCs
endoderm
axial mesoderm
muscle
mural cells /
non-skeletal muscle
mesenchyme
hematopoietic /
vasculature
pronephros
neural
spinal cord / glia
eye
taste / olfactory
otic / lateral line
epidermis
periderm
fin
ionocytes / mucous
pigment cells
Expression by stage/cluster
Correlated gene expression
Positive correlation
Negative correlation
Gene
r
Gene
r
LOC100537032
0.537
dusp2
-0.060
CABZ01055306.1
0.516
selenow1
-0.058
BX571772.1
0.456
tob1b
-0.049
CR848749.2
0.407
pvalb1
-0.048
klhdc8a
0.388
si:dkey-193p11.2
-0.048
cacna1ba
0.382
si:ch211-195b11.3
-0.048
zmp:0000000619
0.310
icn2
-0.047
XLOC-001835
0.309
eif4a1b
-0.046
sec16b
0.284
soul2
-0.046
stc2b
0.277
eno3
-0.046
slc28a1
0.243
tdh
-0.046
LOC108181171
0.236
gbgt1l4
-0.046
hoxc6a
0.234
cox8a
-0.046
si:ch211-66e2.3
0.231
zgc:110333
-0.045
znf1118
0.227
mt-co2
-0.045
LOC110439380
0.227
sdhc
-0.045
XLOC-014886
0.224
fbp1a
-0.044
si:ch73-21k16.1
0.222
ip6k2b
-0.043
CABZ01072563.1
0.221
rpl24
-0.043
bhlha9
0.220
nfe2l2a
-0.043
LOC103910717
0.217
elovl1b
-0.042
si:ch211-235i11.4
0.217
nqo1
-0.042
si:ch73-205h11.1
0.217
mgst1.2
-0.042
or128-10
0.212
si:dkey-248g15.3
-0.042
itgb1b
0.211
spint2
-0.042
prkg1a
0.206
ddit3
-0.042
XLOC-004014
0.199
pvalb2
-0.041
XLOC-003984
0.195
enosf1
-0.041
CR925768.1
0.195
romo1
-0.041
and1
0.192
epdl1
-0.040
LOC103911447
0.191
atp6v1e1b
-0.039
adprhl2
0.186
rnf128a
-0.039
DISP3
0.184
abcb5
-0.039
CABZ01075068.1
0.182
selenow2b
-0.039
cplx3b
0.174
krt17
-0.038