Daniocell
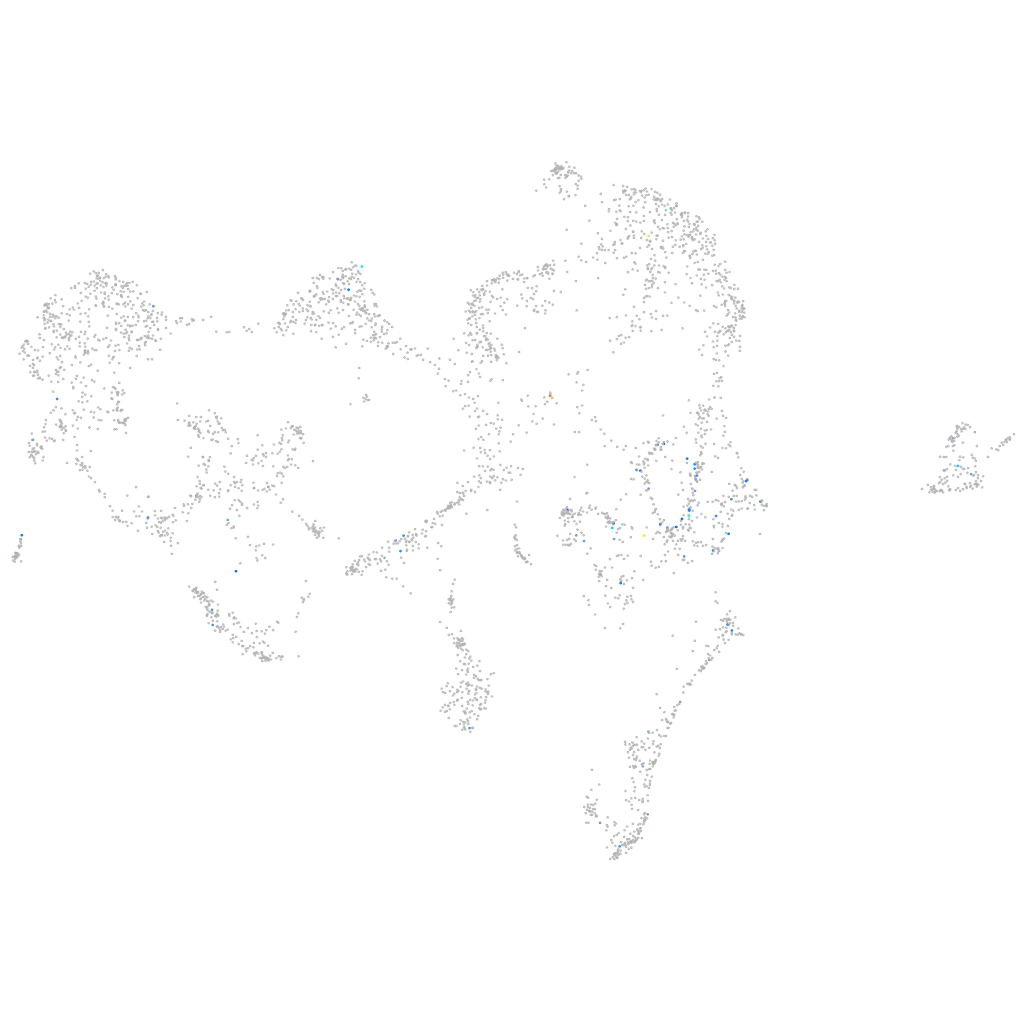
si:ch73-368j24.8 (ionocytes / mucous-producing)
si:ch73-368j24.8
ZFIN
Gene expression UMAP
Display:
Expression
Stage
Other cell groups
all cells
blastomeres
PGCs
endoderm
axial mesoderm
muscle
mural cells /
non-skeletal muscle
mesenchyme
hematopoietic /
vasculature
pronephros
neural
spinal cord / glia
eye
taste / olfactory
otic / lateral line
epidermis
periderm
fin
ionocytes / mucous
pigment cells
Expression by stage/cluster
Correlated gene expression
Positive correlation
Negative correlation
Gene
r
Gene
r
LOC559637
0.391
si:ch211-195b11.3
-0.076
LOC100150791
0.308
nupr1a
-0.070
CR388417.1
0.289
selenow1
-0.065
LOC101885930
0.272
gabarapl2
-0.063
CR513782.1
0.271
tdh
-0.060
LOC101885872
0.260
tmem176l.4
-0.058
ttc41
0.259
BX000438.2
-0.056
pdzd3a
0.253
mdh2
-0.056
adcy2a
0.241
atp5pf
-0.056
CR354435.1
0.237
cox6b2
-0.056
LOC100001908
0.235
si:dkey-193p11.2
-0.055
FP003590.1
0.233
si:dkey-247k7.2
-0.054
si:dkeyp-97a10.1
0.228
spint2
-0.054
FP015823.1
0.224
gstp1
-0.053
mtbp
0.214
selenow2b
-0.053
cryba2a
0.200
krt4
-0.051
LOC101883110
0.198
bloc1s6
-0.051
LOC103909463
0.198
ftr83
-0.051
mir130b
0.197
apodb
-0.051
EGFLAM
0.195
rnf128a
-0.051
LOC101882326
0.192
cst14b.1
-0.049
si:dkeyp-13d11.2
0.190
romo1
-0.049
XLOC-008303
0.187
ppdpfb
-0.049
LOC108179593
0.186
scel
-0.049
robo4
0.186
ier2b
-0.049
melk
0.184
aldob
-0.049
pimr113
0.182
ezrb
-0.048
gpr37a
0.180
tprg1
-0.048
havcr1
0.175
ndufa9a
-0.048
znf987
0.172
rps27l
-0.048
OSCP1 (1 of many)
0.169
NDUFB1
-0.048
XLOC-043091
0.167
sqstm1
-0.048
si:dkey-187a12.4
0.165
dap1b
-0.048
ryr1b
0.164
ppp1cbl
-0.047
LOC101884438
0.162
ndufb9
-0.047