Daniocell
si:ch73-368j24.8 (muscle)
si:ch73-368j24.8
ZFIN
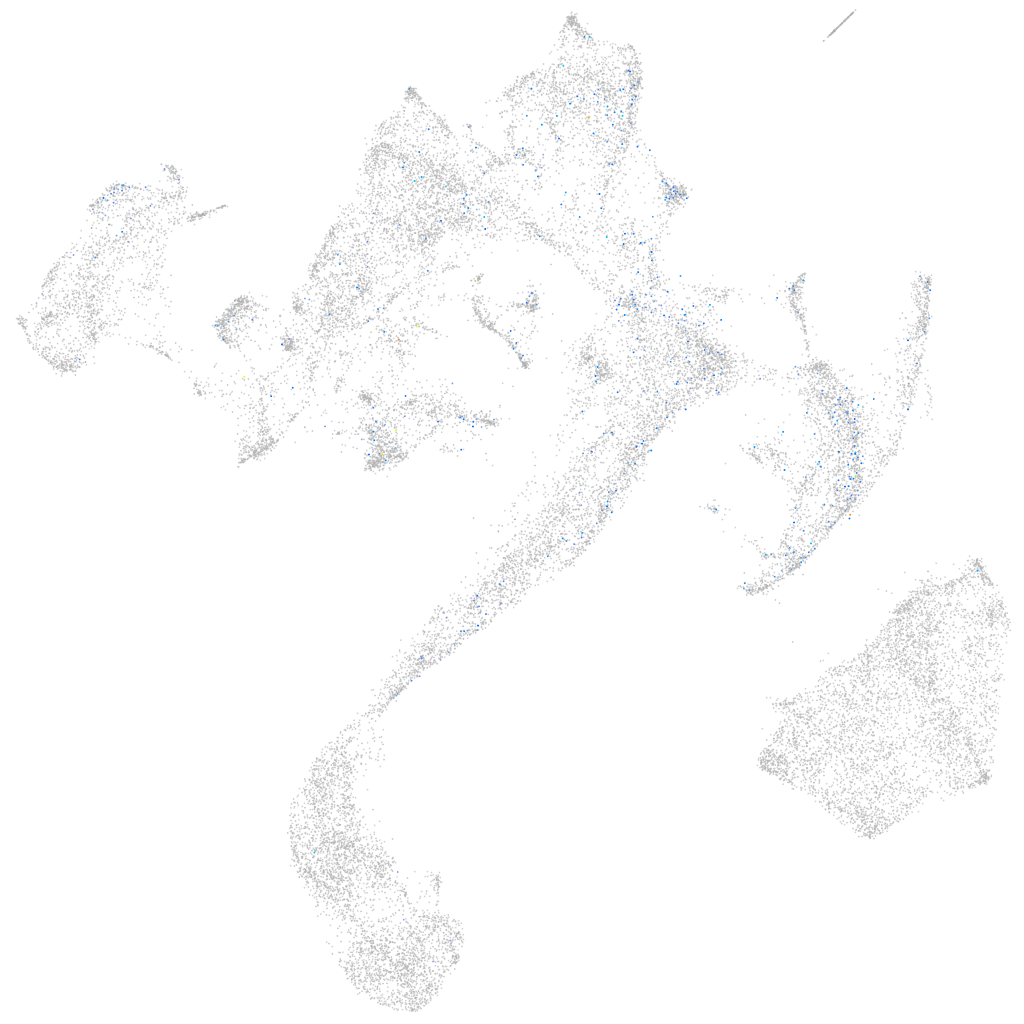
Gene expression UMAP
Display:
Expression
Stage
Other cell groups
all cells
blastomeres
PGCs
endoderm
axial mesoderm
muscle
mural cells /
non-skeletal muscle
mesenchyme
hematopoietic /
vasculature
pronephros
neural
spinal cord / glia
eye
taste / olfactory
otic / lateral line
epidermis
periderm
fin
ionocytes / mucous
pigment cells
Expression by stage/cluster
Correlated gene expression
Positive correlation
Negative correlation
Gene
r
Gene
r
si:ch211-113a14.22
0.109
si:ch211-152c2.3
-0.048
XLOC-044229
0.105
si:dkey-16p21.8
-0.045
BX004785.1
0.103
stm
-0.040
zgc:165555.3
0.102
glud1b
-0.039
zgc:174180
0.099
gapdh
-0.038
hist1h2a11
0.097
pvalb1
-0.037
RYR2
0.095
si:ch211-255p10.3
-0.037
h3f3a
0.093
rps18
-0.036
zgc:163040.1
0.093
prx
-0.036
si:ch211-113a14.27
0.092
tnnt3b
-0.036
LOC101886468
0.092
COX7A2
-0.036
si:dkey-23a13.7
0.091
tnni2a.4
-0.036
zgc:163061
0.091
cox7c
-0.036
si:dkey-261m9.17
0.091
eef2l2
-0.035
XLOC-010093
0.089
ckma
-0.035
si:ch1073-159d7.13
0.086
pvalb2
-0.035
zgc:154164
0.085
slc25a4
-0.035
dut
0.085
NC-002333.4
-0.035
LOC564610.1
0.084
nme2b.2
-0.035
zgc:153409
0.083
tnnt3a
-0.035
LOC110440222
0.080
CABZ01061524.1
-0.034
hist1h4l
0.080
BX927327.1
-0.034
svopa
0.078
ryr3
-0.034
hnrnpa0l
0.078
ckmb
-0.034
sinhcafl
0.077
casq1b
-0.033
CABZ01090041.1
0.076
gpd1b
-0.033
si:ch1073-429i10.3.1
0.074
si:dkey-211f22.5
-0.033
zgc:56493
0.073
pkmb
-0.033
si:ch73-36p18.4
0.073
ca9
-0.033
rrm2
0.072
casq1a
-0.033
h2afx
0.072
myoz1b
-0.033
FP236812.2
0.071
si:ch73-367p23.2
-0.033
zgc:171759
0.071
tnnc2
-0.033
CT583650.1
0.071
hrc
-0.033
si:dkeyp-13d11.2
0.070
si:ch73-366l1.5
-0.033