Daniocell
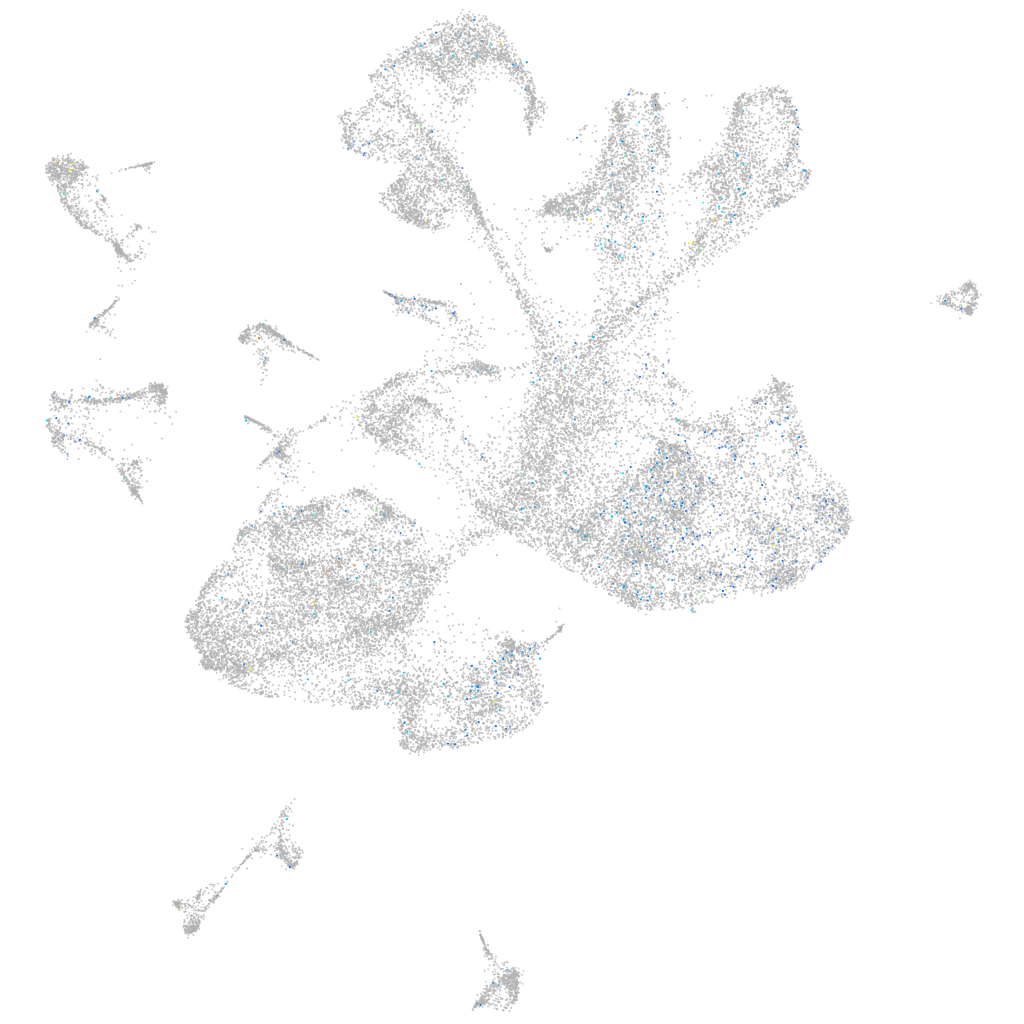
si:ch73-368j24.8 (glial cells / spinal cord)
si:ch73-368j24.8
ZFIN
Gene expression UMAP
Display:
Expression
Stage
Other cell groups
all cells
blastomeres
PGCs
endoderm
axial mesoderm
muscle
mural cells /
non-skeletal muscle
mesenchyme
hematopoietic /
vasculature
pronephros
neural
spinal cord / glia
eye
taste / olfactory
otic / lateral line
epidermis
periderm
fin
ionocytes / mucous
pigment cells
Expression by stage/cluster
Correlated gene expression
Positive correlation
Negative correlation
Gene
r
Gene
r
FP085399.4
0.091
gpm6bb
-0.029
si:ch73-343l4.8
0.088
ppdpfb
-0.029
zgc:165555.3
0.087
mdkb
-0.027
hist1h4l
0.080
pvalb1
-0.026
hist1h2a11
0.074
slc1a2b
-0.026
si:dkey-261m9.17
0.074
dap1b
-0.026
zgc:153760
0.072
hepacama
-0.025
LOC110438909
0.068
ptn
-0.025
zgc:110216
0.068
slc6a11b
-0.024
fbxo5
0.067
CU467822.1
-0.024
mibp
0.067
fabp7a
-0.024
hist1h2a9
0.066
gpr37l1b
-0.024
LOC108179079
0.063
itm2ba
-0.024
FO834903.1
0.063
ckbb
-0.024
CZQB01066256.1
0.061
ndrg3a
-0.024
BX510949.1
0.061
slc6a1b
-0.023
si:ch211-113a14.18
0.060
aldocb
-0.023
zgc:153405
0.059
hspb15
-0.023
mki67
0.059
zgc:165461
-0.023
zgc:110425
0.059
cx43
-0.023
zgc:173585
0.059
serpina10a
-0.023
BX545856.1
0.059
CR848047.1
-0.022
si:dkey-108k21.10
0.058
si:ch211-260e23.9
-0.022
h2afx
0.058
nell2a
-0.022
si:ch1073-153i20.4
0.057
si:dkey-7j14.6
-0.022
si:dkey-261m9.6
0.057
atp1b4
-0.022
CR354435.1
0.057
flot2a
-0.021
CR391977.1
0.055
mgll
-0.021
cks1b
0.055
slc1a3b
-0.021
dek
0.053
si:dkey-204f11.64
-0.021
LOC100537439
0.053
wbp2nl
-0.021
olfcg4
0.053
tex264a
-0.021
CR749168.4
0.051
glula
-0.021
LOC100148591
0.051
slc3a2a
-0.021
rrm2
0.051
ndrg2
-0.021