Daniocell
si:ch73-368j24.8 (axial mesoderm)
si:ch73-368j24.8
ZFIN
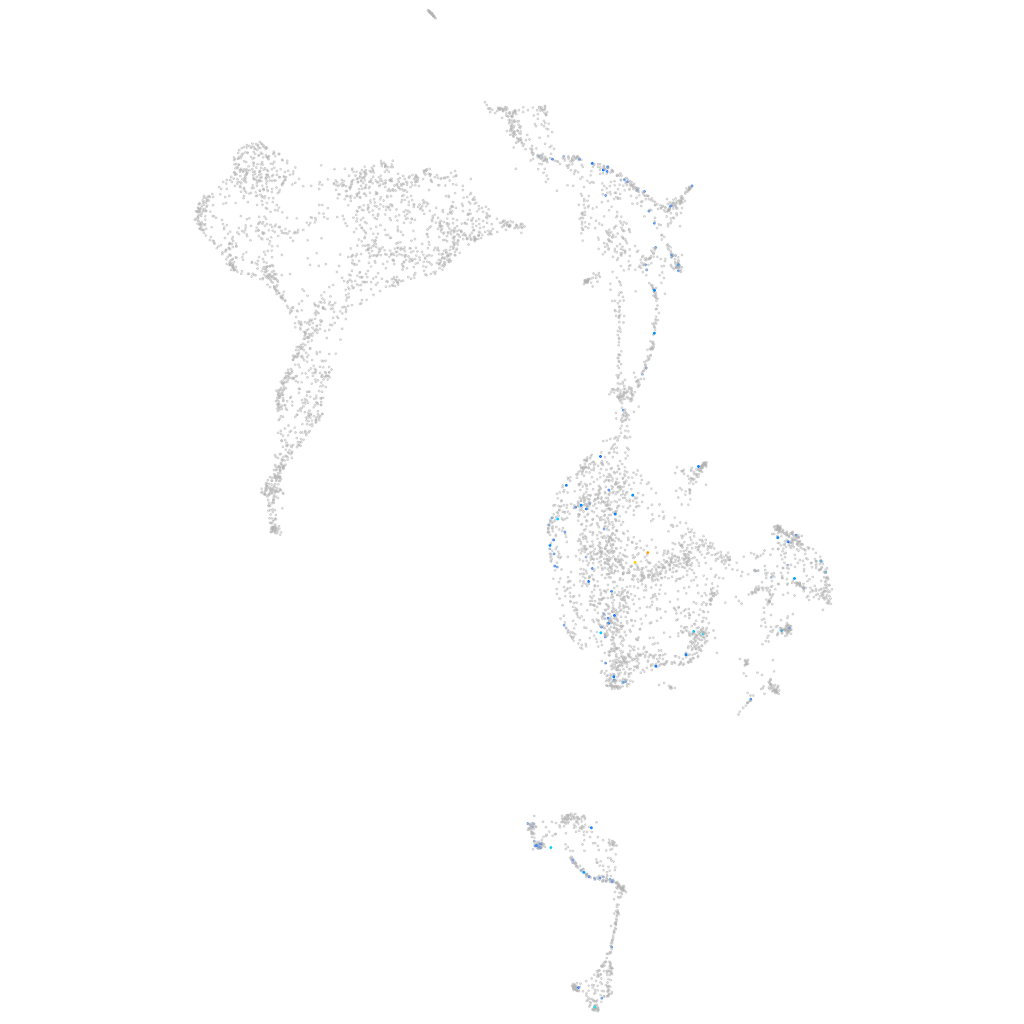
Gene expression UMAP
Display:
Expression
Stage
Other cell groups
all cells
blastomeres
PGCs
endoderm
axial mesoderm
muscle
mural cells /
non-skeletal muscle
mesenchyme
hematopoietic /
vasculature
pronephros
neural
spinal cord / glia
eye
taste / olfactory
otic / lateral line
epidermis
periderm
fin
ionocytes / mucous
pigment cells
Expression by stage/cluster
Correlated gene expression
Positive correlation
Negative correlation
Gene
r
Gene
r
si:ch73-27e22.1
0.232
stm
-0.079
si:ch73-335l21.1
0.211
nop58
-0.078
si:ch211-113a14.15
0.196
fbl
-0.078
BX000696.1
0.185
hnrnpa1a
-0.078
BX511082.1
0.185
hnrnpabb
-0.075
LOC100004499
0.170
NC-002333.4
-0.075
XLOC-011416
0.162
ncl
-0.075
si:ch1073-159d7.13
0.157
rbm4.3
-0.074
zgc:194392
0.144
ebna1bp2
-0.074
si:ch211-214p13.9
0.141
snrnp70
-0.074
XLOC-042228
0.140
nucks1a
-0.073
thsd7ba
0.138
thrap3b
-0.073
LOC110440177
0.136
ddx18
-0.073
drd1a
0.135
safb
-0.073
zgc:154164
0.132
acin1a
-0.072
alkal2b
0.130
chd4b
-0.072
hist1h4l
0.130
nop56
-0.072
glra4b
0.129
gar1
-0.071
or133-2
0.128
top1l
-0.071
ripor1.1
0.128
rps18
-0.071
tecpr1b
0.126
snu13b
-0.070
si:ch1073-159d7.10.1
0.126
hnrnpa1b
-0.070
si:ch1073-159d7.6
0.123
hspb1
-0.070
cnstb
0.123
ilf3b
-0.070
LOC101884967
0.120
sfpq
-0.069
armc5
0.120
cd2bp2
-0.069
nr3c2
0.118
sf3b2
-0.069
LOC101885065
0.116
dkc1
-0.069
CT737162.1
0.116
si:dkey-67c22.2
-0.069
CU137681.1
0.114
acin1b
-0.068
LOC110437954
0.113
sf3b4
-0.068
LOC101883803
0.113
anp32b
-0.068
lama2
0.110
ppig
-0.068
LOC103909452
0.110
hnrnpm
-0.068
zgc:165555.3
0.110
npm1a
-0.067