Daniocell
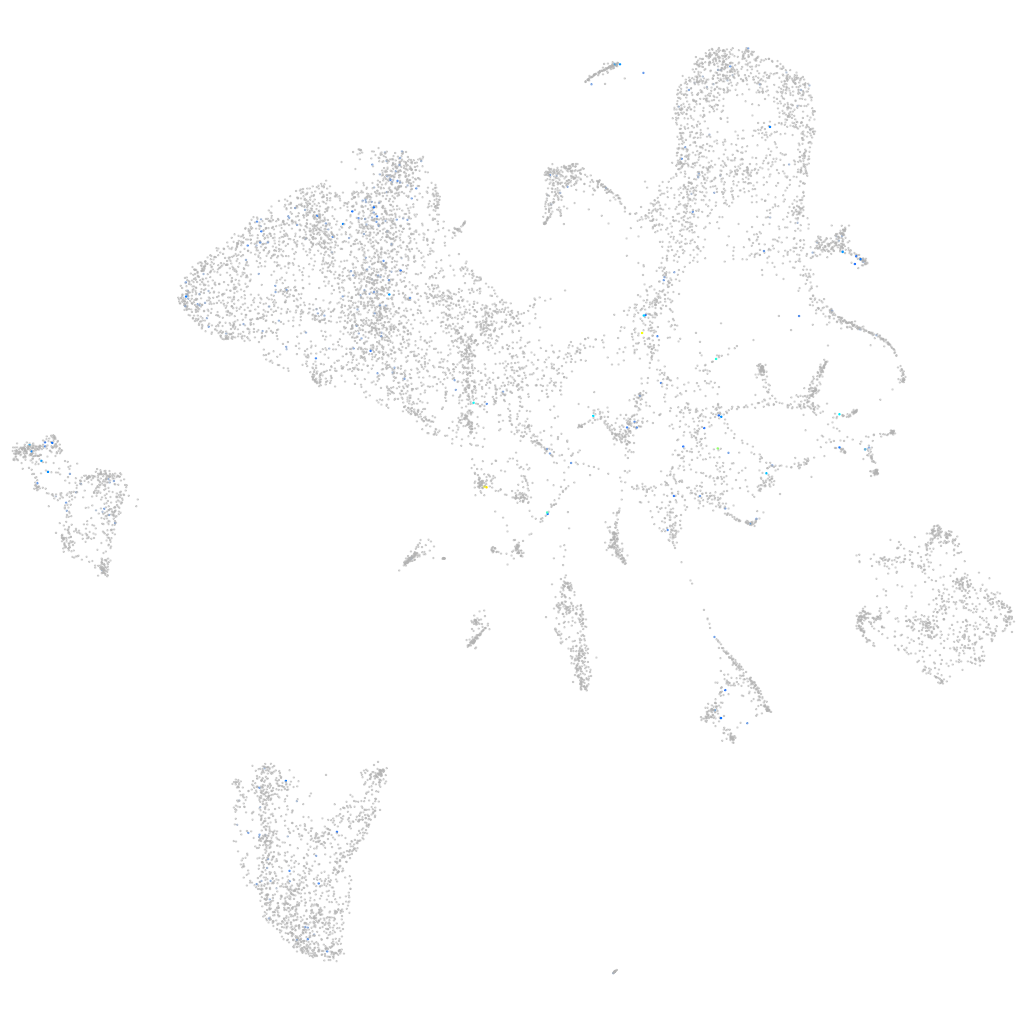
si:ch73-368j24.8 (endoderm)
si:ch73-368j24.8
ZFIN
Gene expression UMAP
Display:
Expression
Stage
Other cell groups
all cells
blastomeres
PGCs
endoderm
axial mesoderm
muscle
mural cells /
non-skeletal muscle
mesenchyme
hematopoietic /
vasculature
pronephros
neural
spinal cord / glia
eye
taste / olfactory
otic / lateral line
epidermis
periderm
fin
ionocytes / mucous
pigment cells
Expression by stage/cluster
Correlated gene expression
Positive correlation
Negative correlation
Gene
r
Gene
r
CABZ01088229.1
0.231
apoeb
-0.034
tlx1
0.199
dhrs3b
-0.028
LOC103912007
0.184
hspb1
-0.027
si:dkey-237m9.2
0.177
si:dkeyp-2e4.3
-0.026
nr4a2a
0.174
srrm2
-0.026
si:ch211-283g2.2
0.167
apoa1a
-0.025
si:ch211-33e4.3
0.165
vox
-0.025
epn3b
0.153
sb:cb81
-0.025
LOC110439323
0.149
asph
-0.025
si:ch1073-159d7.13
0.148
si:dkey-66i24.9
-0.024
BX470218.1
0.147
cdkn1ca
-0.024
XLOC-013439
0.141
sp5l
-0.024
FP085399.2
0.131
cxcr4a
-0.024
CABZ01079853.1
0.129
sox32
-0.024
BX649388.2
0.129
ackr3b
-0.024
NRXN2
0.128
wu:fb97g03
-0.023
LOC108192020
0.127
sox17
-0.023
CR354372.1
0.124
metrnla
-0.023
si:ch211-106a19.1
0.122
morc2
-0.023
lbx1a
0.121
ppan
-0.022
b4galt2
0.115
ca9
-0.022
BX842692.1
0.115
nusap1
-0.022
st18
0.115
fabp1b.1
-0.022
ddr2b
0.114
irx7
-0.022
BX664610.1
0.112
gar1
-0.022
zgc:194418
0.112
zic2b
-0.022
cacna2d2b
0.111
tbx16
-0.022
CNNM1
0.110
scaf1
-0.022
si:dkey-23a13.22
0.109
rgcc
-0.022
FO904868.1
0.109
fn1a
-0.021
tmem121aa
0.107
s100a1
-0.021
thsd7aa
0.105
acsl1b
-0.021
mhc1uba
0.103
rbm19
-0.021
LOC110439701
0.101
ddx19
-0.021
si:ch211-151m7.6
0.100
LOC100008030
-0.021