Daniocell
si:ch73-368j24.8 (hematopoietic / vasculature)
si:ch73-368j24.8
ZFIN
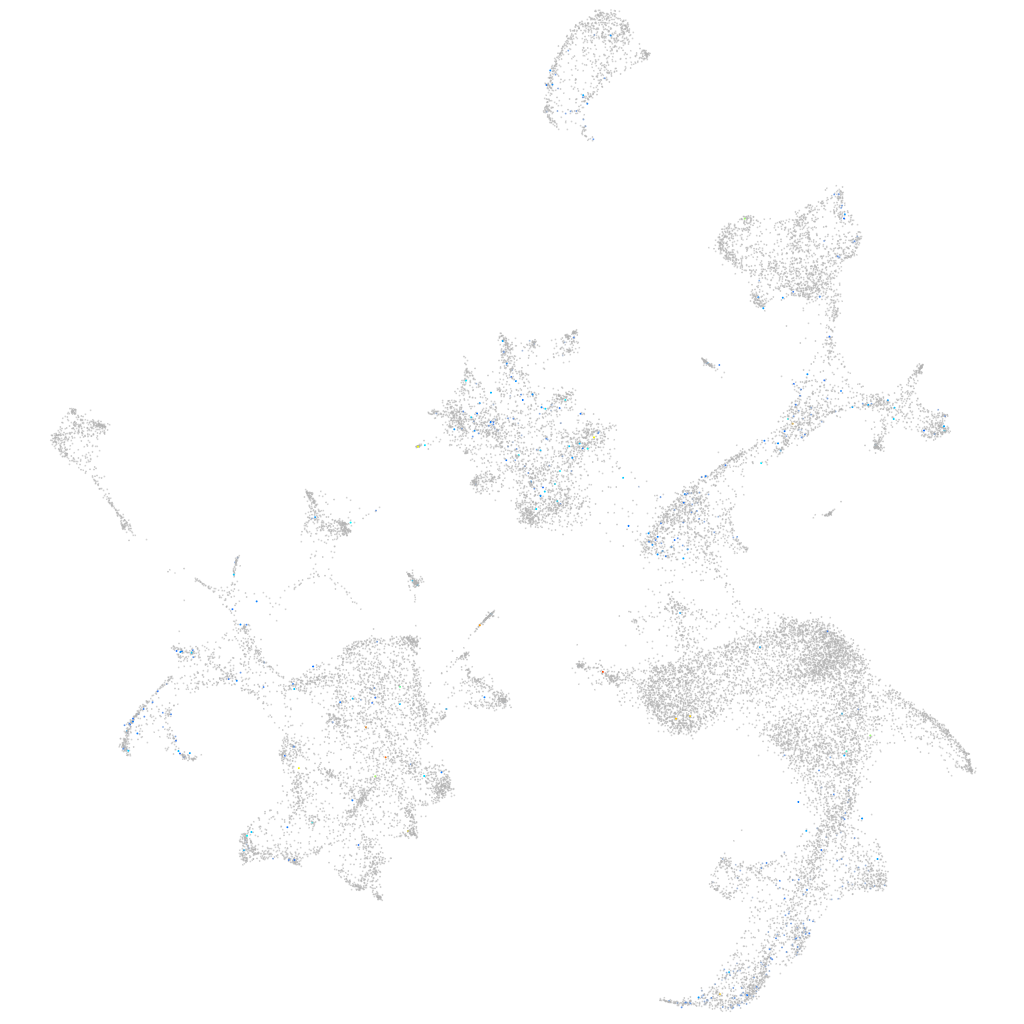
Gene expression UMAP
Display:
Expression
Stage
Other cell groups
all cells
blastomeres
PGCs
endoderm
axial mesoderm
muscle
mural cells /
non-skeletal muscle
mesenchyme
hematopoietic /
vasculature
pronephros
neural
spinal cord / glia
eye
taste / olfactory
otic / lateral line
epidermis
periderm
fin
ionocytes / mucous
pigment cells
Expression by stage/cluster
Correlated gene expression
Positive correlation
Negative correlation
Gene
r
Gene
r
pcyt1bb
0.130
ccni
-0.040
zgc:165555.3
0.097
creg1
-0.039
si:dkey-261m9.17
0.092
bloc1s6
-0.038
hist1h4l
0.091
gpx1a
-0.037
si:dkey-188i13.6
0.087
pvalb1
-0.032
hist1h2a10
0.086
XLOC-043857
-0.032
si:ch211-113a14.29
0.082
zgc:92606
-0.032
si:dkeyp-82a1.8
0.079
plac8l1
-0.032
slc2a9l2
0.078
tmod4
-0.032
h3f3a
0.077
gabarapa
-0.029
znf1090
0.077
eef2l2
-0.029
dut
0.076
pvalb2
-0.026
si:dkey-261m9.18
0.075
nt5e
-0.026
XLOC-015908
0.075
gabarapb
-0.025
si:ch1073-153i20.3
0.074
mterf3
-0.025
BX601648.1
0.074
gp9
-0.025
hist1h2a9
0.073
nt5c2l1
-0.024
BX957361.1
0.073
LOC101885776
-0.024
zgc:153409
0.071
cahz
-0.024
si:dkeyp-85h7.1
0.070
nprl3
-0.023
XLOC-011835
0.069
mylpfb
-0.023
CR932077.1
0.068
si:ch211-250g4.3
-0.023
tmem232
0.067
actc1b
-0.023
hmgb2b
0.067
faxdc2
-0.022
hmgb2a
0.067
apoa2
-0.022
zgc:110216
0.066
tmem59
-0.021
XLOC-043545
0.066
si:ch211-207c6.2
-0.021
ccl19b
0.065
gpx4a
-0.021
cyb5d1
0.064
cav1
-0.020
CR936249.1
0.064
mrc1b
-0.020
LOC101882910
0.064
adssl1
-0.020
XLOC-025686
0.064
tbcelb
-0.020
xkr5b
0.063
hemgn
-0.020
si:ch211-222l21.1
0.063
slc16a10
-0.020
h2afvb
0.063
tnni2a.4
-0.020