Daniocell
si:ch211-235o23.1 (pigment cells)
si:ch211-235o23.1
ZFIN
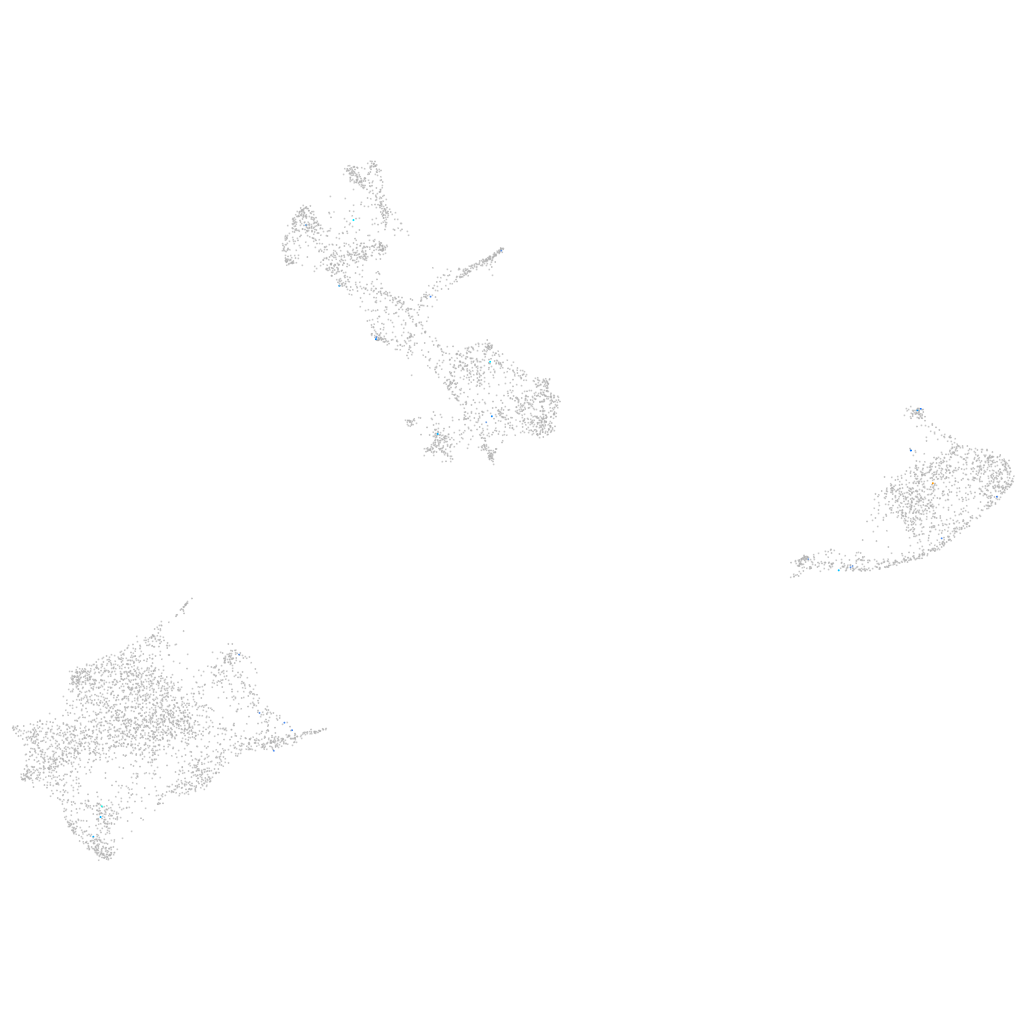
Gene expression UMAP
Display:
Expression
Stage
Other cell groups
all cells
blastomeres
PGCs
endoderm
axial mesoderm
muscle
mural cells /
non-skeletal muscle
mesenchyme
hematopoietic /
vasculature
pronephros
neural
spinal cord / glia
eye
taste / olfactory
otic / lateral line
epidermis
periderm
fin
ionocytes / mucous
pigment cells
Expression by stage/cluster
Correlated gene expression
Positive correlation
Negative correlation
Gene
r
Gene
r
CU459012.1
0.406
gch2
-0.036
cga
0.284
gstp1
-0.034
LO017850.1
0.254
slc22a7a
-0.034
h2af1al
0.243
uraha
-0.029
XLOC-026855
0.228
mylpfa
-0.028
BX088603.3
0.216
si:dkey-251i10.2
-0.027
atg4db
0.198
CABZ01021592.1
-0.026
CR391910.2
0.194
myhz1.1
-0.025
XLOC-002539
0.190
zgc:110339
-0.025
CR925755.2
0.190
mdh1aa
-0.024
klf17
0.187
cyb5a
-0.023
rell2
0.187
actc1b
-0.023
gtf3c4
0.187
marcksl1b
-0.023
LOC110438604
0.169
zgc:153031
-0.022
hif1al2
0.166
rbp4l
-0.020
LOC103908954
0.166
cotl1
-0.020
si:ch73-236c18.5
0.163
paics
-0.019
XLOC-029389
0.163
oacyl
-0.018
BX547934.1
0.161
glrx3
-0.018
BX914205.2
0.161
txn
-0.018
wt1b
0.155
lgals2a
-0.018
LOC101886786
0.154
pik3c3
-0.018
CR391915.1
0.153
akr1b1
-0.018
phox2ba
0.151
arpc3
-0.017
XLOC-032954
0.148
gpd1b
-0.017
si:dkey-102g19.3
0.148
CABZ01032488.1
-0.017
ftr87
0.144
dpysl3
-0.017
BX663516.2
0.141
pdxka
-0.017
ssx2ipa
0.141
tax1bp3
-0.017
LOC101884182
0.135
idh1
-0.017
plekhg6
0.134
tmem130
-0.017
CU076099.1
0.128
gyg1b
-0.016
LOC796088
0.126
tnnc2
-0.016
tec
0.124
epdr1
-0.016
slc6a22.2
0.123
rab1ba
-0.016