Daniocell
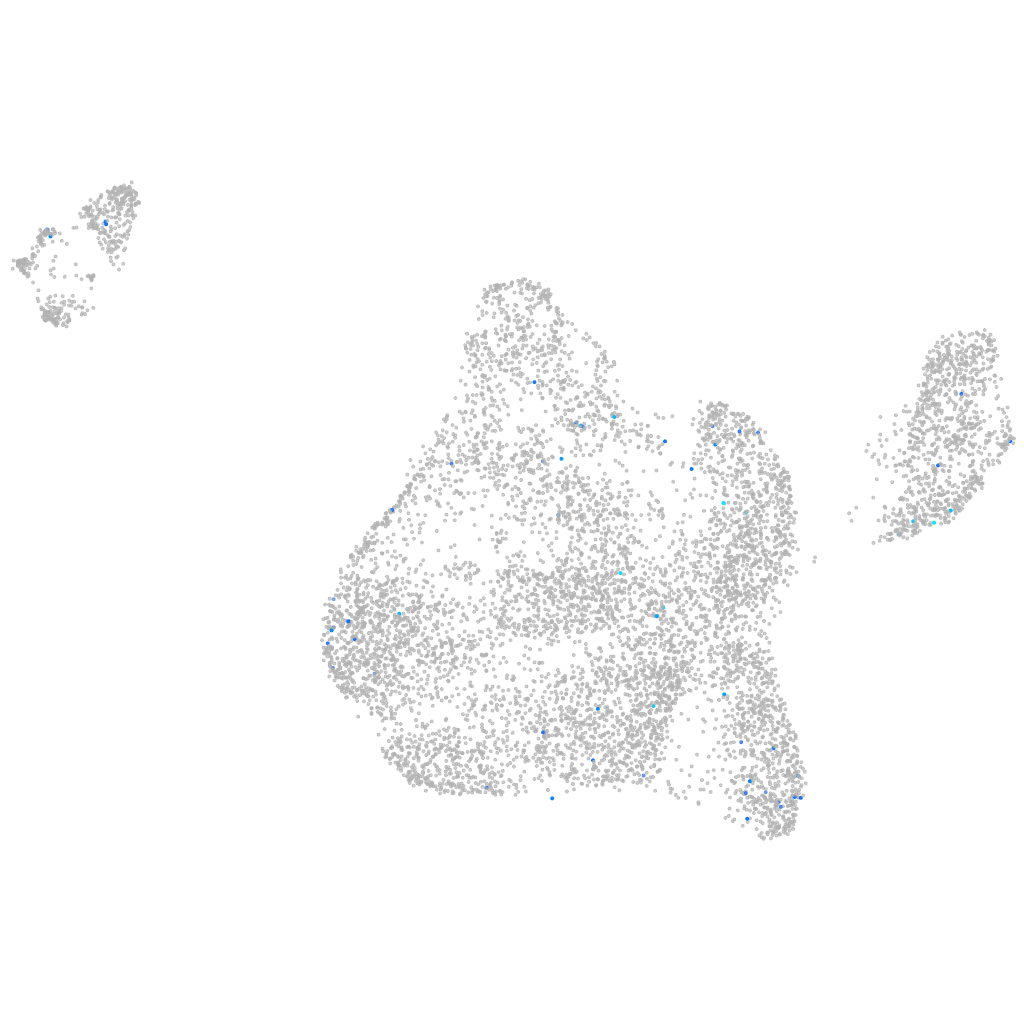
si:ch211-235o23.1 (blastomeres)
si:ch211-235o23.1
ZFIN
Gene expression UMAP
Display:
Expression
Stage
Other cell groups
all cells
blastomeres
PGCs
endoderm
axial mesoderm
muscle
mural cells /
non-skeletal muscle
mesenchyme
hematopoietic /
vasculature
pronephros
neural
spinal cord / glia
eye
taste / olfactory
otic / lateral line
epidermis
periderm
fin
ionocytes / mucous
pigment cells
Expression by stage/cluster
Correlated gene expression
Positive correlation
Negative correlation
Gene
r
Gene
r
XLOC-016798
0.210
polr1d
-0.031
LOC103910533
0.207
mgst3b
-0.030
CABZ01046996.1
0.182
calm2a
-0.028
LOC103911819
0.180
gnmt
-0.027
cyr61l2
0.167
si:ch211-133n4.4
-0.026
LOC103911885
0.150
XLOC-043201
-0.026
si:dkey-261j11.3
0.148
mrpl38
-0.026
cyp46a1.1
0.145
phf23a
-0.025
gad1b
0.144
uba2
-0.025
si:ch211-220m6.4
0.142
gnb4b
-0.025
p4ha3
0.139
tle2a
-0.024
XLOC-044302
0.124
reep2
-0.024
zgc:123217
0.123
dhx15
-0.024
CR352292.1
0.113
tma7
-0.024
si:dkey-148a17.5
0.113
COX7A2
-0.023
tecpr1b
0.109
anp32a
-0.023
capn1b
0.107
idi1
-0.023
fryb
0.106
anapc10
-0.023
gdpd4b
0.106
si:dkey-67c22.2
-0.023
BX005421.3
0.105
rap1aa
-0.022
LOC103910371
0.103
cenpx
-0.022
si:dkeyp-80d11.4
0.100
smim13
-0.022
LOC103909099
0.097
pgpep1
-0.022
LOC101883789
0.097
zmat2
-0.022
mst1rb
0.097
pdap1b
-0.022
LOC100148510
0.096
arf6b
-0.022
LOC101882645
0.094
zgc:77262
-0.022
emid1
0.094
psmb6
-0.022
BX649421.1
0.092
wdr32
-0.022
LOC110439827
0.089
phc1
-0.022
si:dkey-202g17.3
0.088
epyc
-0.022
si:dkey-191g9.7
0.086
hspd1
-0.022
c6ast3
0.084
ppp2r1ba
-0.022
fn1b
0.084
ddx51
-0.022
prss60.2
0.083
zc3h11a
-0.021