Daniocell
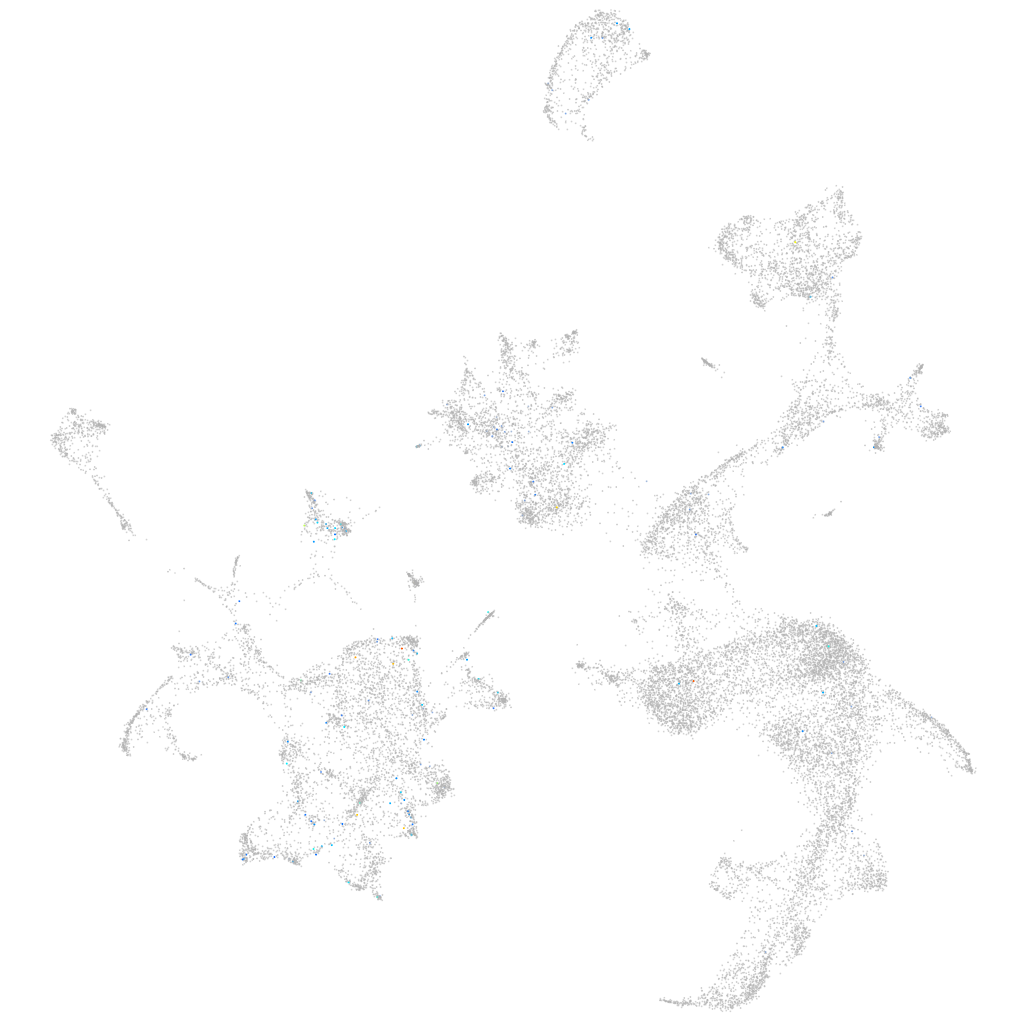
si:ch211-235o23.1 (hematopoietic / vasculature)
si:ch211-235o23.1
ZFIN
Gene expression UMAP
Display:
Expression
Stage
Other cell groups
all cells
blastomeres
PGCs
endoderm
axial mesoderm
muscle
mural cells /
non-skeletal muscle
mesenchyme
hematopoietic /
vasculature
pronephros
neural
spinal cord / glia
eye
taste / olfactory
otic / lateral line
epidermis
periderm
fin
ionocytes / mucous
pigment cells
Expression by stage/cluster
Correlated gene expression
Positive correlation
Negative correlation
Gene
r
Gene
r
XLOC-021944
0.224
hbae1.1
-0.047
LOC110439347
0.141
prdx2
-0.046
XLOC-039214
0.136
hbae1.3
-0.045
CR932999.1
0.133
hbae3
-0.045
ephx4
0.132
hbbe1.3
-0.044
LOC101886743
0.131
fth1a
-0.043
gyg2
0.128
hbbe2
-0.043
lrrc3
0.123
hemgn
-0.043
si:dkey-30c15.2
0.122
alas2
-0.042
si:ch211-212k5.4
0.119
hbbe1.1
-0.041
XLOC-036274
0.113
cahz
-0.041
CR450836.1
0.100
hbbe1.2
-0.039
LOC103911037
0.098
zgc:163057
-0.039
BX569779.1
0.097
tspo
-0.038
LOC100149554.1
0.094
nt5c2l1
-0.038
st8sia7.1
0.094
blvrb
-0.038
LOC101884529
0.092
slc4a1a
-0.037
ano9b
0.090
epb41b
-0.035
XLOC-040073
0.090
si:ch211-207c6.2
-0.033
CU302316.1
0.088
hbbe3
-0.032
frmd7
0.087
slc11a2
-0.032
si:dkey-4e4.1
0.087
nmt1b
-0.032
znf1097
0.085
plac8l1
-0.031
gls2a
0.082
creg1
-0.031
krt94
0.081
znfl2a
-0.031
CR392026.2
0.077
sptb
-0.030
LOC108191976
0.074
si:ch211-250g4.3
-0.030
vmo1b
0.074
tfr1a
-0.030
LOC100329795
0.073
tmod4
-0.029
CT027989.1
0.071
hbae5
-0.029
tspan4b
0.070
urod
-0.029
bmpr2a
0.070
zgc:56095
-0.028
dgat2
0.070
uros
-0.027
plcd1a
0.069
ucp3
-0.026
si:dkey-11d20.1
0.068
hdr
-0.026