Daniocell
si:ch211-235o23.1 (mesenchyme)
si:ch211-235o23.1
ZFIN
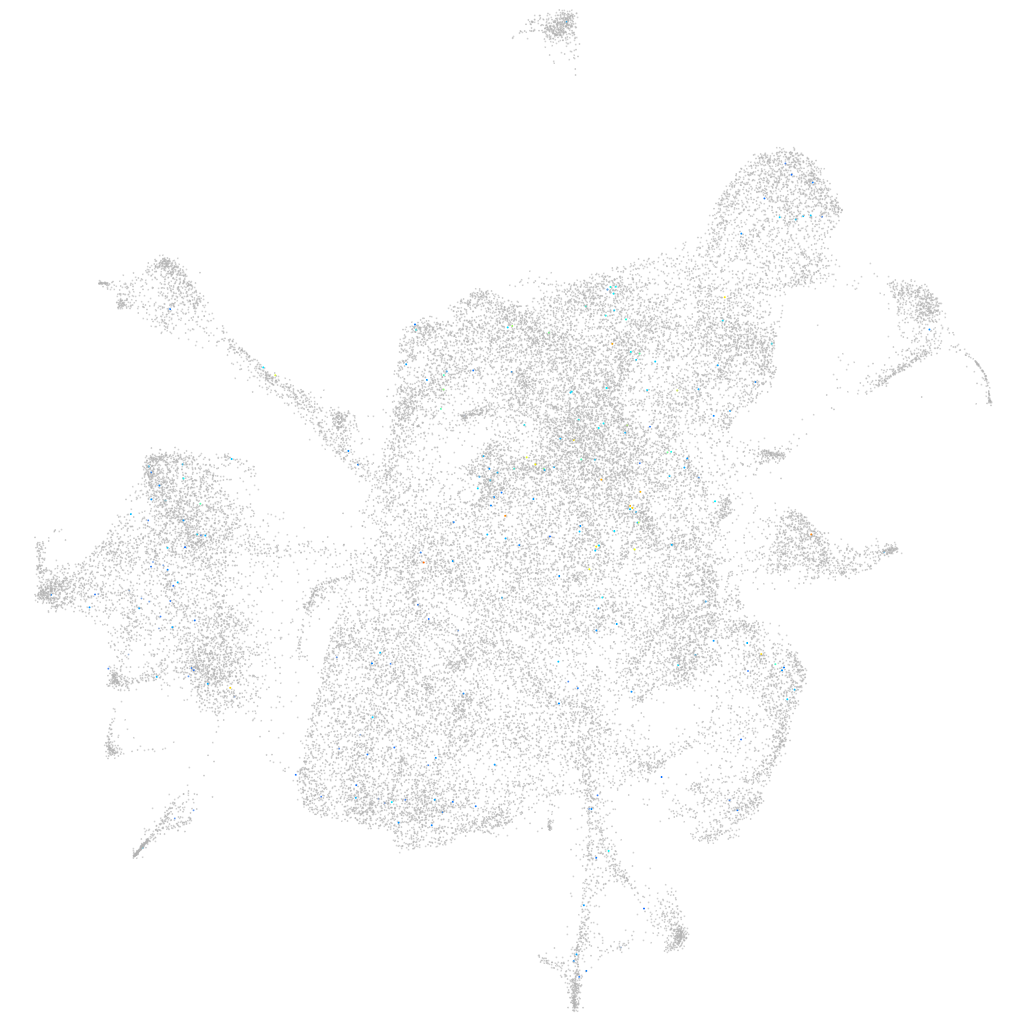
Gene expression UMAP
Display:
Expression
Stage
Other cell groups
all cells
blastomeres
PGCs
endoderm
axial mesoderm
muscle
mural cells /
non-skeletal muscle
mesenchyme
hematopoietic /
vasculature
pronephros
neural
spinal cord / glia
eye
taste / olfactory
otic / lateral line
epidermis
periderm
fin
ionocytes / mucous
pigment cells
Expression by stage/cluster
Correlated gene expression
Positive correlation
Negative correlation
Gene
r
Gene
r
XLOC-029654
0.110
rps29
-0.029
si:dkey-57c15.1
0.087
si:dkey-151g10.6
-0.028
si:ch73-285p12.4
0.073
rplp2l
-0.025
AL935044.4
0.070
hmga1a
-0.022
si:dkey-21p1.3
0.063
rps28
-0.021
myct1b
0.061
rpl38
-0.021
fhdc5
0.058
rpl29
-0.021
mrap2b
0.057
rps12
-0.021
LOC103911727
0.056
apex1
-0.020
gpr135
0.055
dut
-0.020
tradv24.0.1
0.053
ptges3b
-0.019
METTL21C
0.051
si:ch211-288g17.3
-0.019
CR749775.1
0.048
pabpc1a
-0.019
gpr183b
0.047
stmn1a
-0.019
or132-5
0.045
hirip3
-0.018
XLOC-011926
0.045
mcm7
-0.018
spsb3b
0.045
zgc:193541
-0.018
XLOC-021586
0.044
cct4
-0.018
znf997
0.043
pfdn4
-0.018
BX537303.1
0.043
sumo3b
-0.018
CT030153.1
0.042
fbl
-0.018
XLOC-038255
0.042
rpl37
-0.017
si:ch211-218h8.3
0.042
rpa3
-0.017
si:dkey-83f18.6
0.042
rpl39
-0.017
zgc:173581
0.042
nop58
-0.017
XLOC-043761
0.042
mcm6
-0.017
adrb2b
0.041
fen1
-0.017
btr29
0.041
ssrp1a
-0.017
mfap5
0.041
tsr2
-0.017
zgc:66473
0.040
hmgn6
-0.017
LOC108184024
0.040
nasp
-0.017
LOC103909470
0.039
npm1a
-0.017
CR396595.1
0.039
chaf1a
-0.017
slc2a1a
0.039
hypk
-0.017
BX548073.11
0.038
snrpb
-0.016