Daniocell
si:ch211-235o23.1 (muscle)
si:ch211-235o23.1
ZFIN
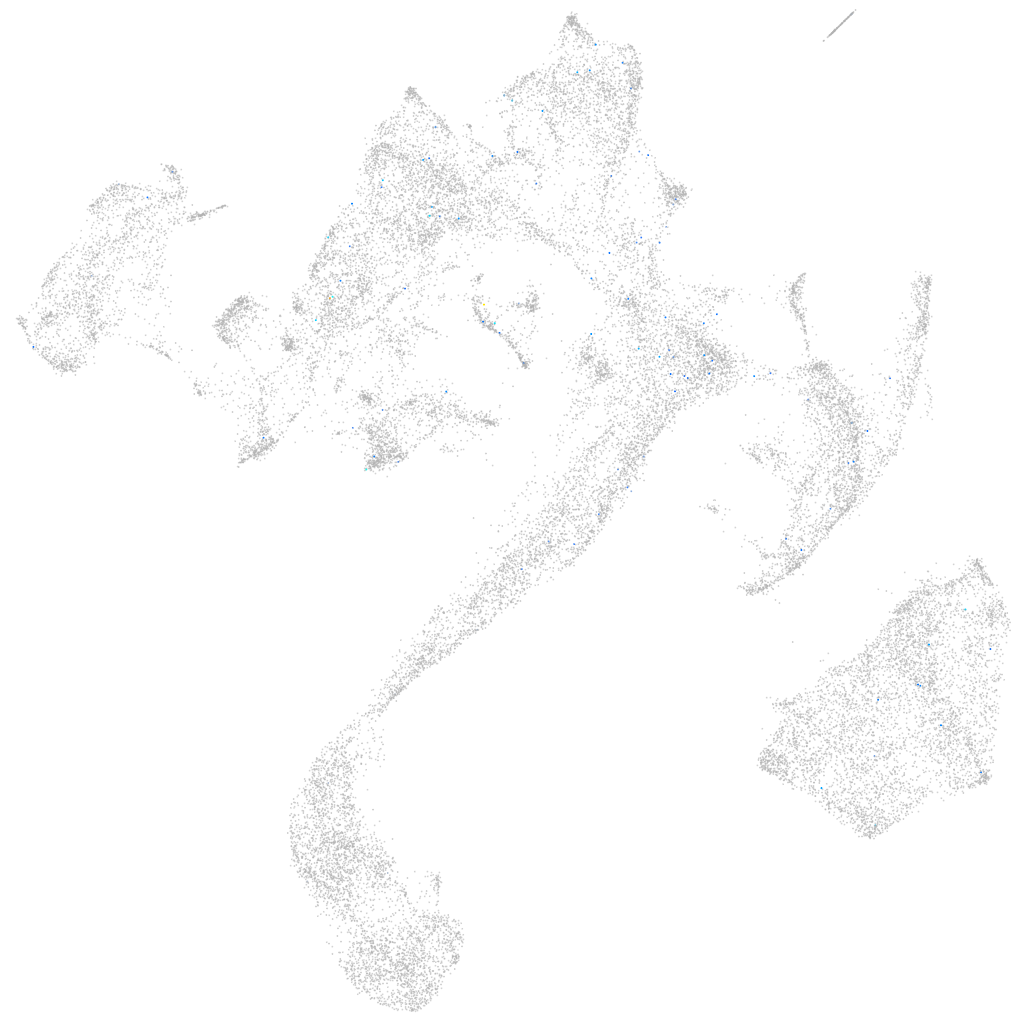
Gene expression UMAP
Display:
Expression
Stage
Other cell groups
all cells
blastomeres
PGCs
endoderm
axial mesoderm
muscle
mural cells /
non-skeletal muscle
mesenchyme
hematopoietic /
vasculature
pronephros
neural
spinal cord / glia
eye
taste / olfactory
otic / lateral line
epidermis
periderm
fin
ionocytes / mucous
pigment cells
Expression by stage/cluster
Correlated gene expression
Positive correlation
Negative correlation
Gene
r
Gene
r
si:ch211-239d6.2
0.207
CABZ01078594.1
-0.025
srd5a2b
0.182
gapdh
-0.025
si:dkeyp-44d3.3
0.163
aldoab
-0.025
si:dkey-223p19.2
0.145
ank1a
-0.023
vipr1b
0.121
atp2a1
-0.023
LOC103911431
0.115
acta1b
-0.023
si:ch211-282j17.13
0.112
tnnc2
-0.023
LOC100536112
0.105
hhatla
-0.022
BX005398.1
0.099
ndufb6
-0.022
BX530034.1
0.097
cfl2
-0.022
CR354549.11
0.096
ckma
-0.022
XLOC-043447
0.094
tmod4
-0.022
LOC107195253
0.091
mybphb
-0.022
CU914164.1
0.087
cycsb
-0.022
CU672228.1
0.082
actc1b
-0.021
slc2a11a
0.082
actn3b
-0.021
CU693379.1
0.078
myl1
-0.021
opn7c
0.077
smyd1a
-0.021
CR538726.1
0.074
desma
-0.021
XLOC-026713
0.073
neb
-0.021
tapbpl
0.071
cav3
-0.021
si:ch73-18b11.2
0.071
ak1
-0.021
CABZ01066320.1
0.071
XLOC-005350
-0.021
trpc6a
0.070
si:ch73-367p23.2
-0.021
LOC110439505
0.069
mylpfb
-0.021
lipib
0.068
ogdha
-0.021
rxfp3.2b
0.068
acta1a
-0.021
pkd1l2b
0.068
cox7a2a
-0.021
XLOC-036447
0.066
pgam2
-0.021
XLOC-031893
0.066
tnnt3a
-0.021
tac3a
0.066
ldb3a
-0.021
slc38a11
0.064
myoz1b
-0.021
pkhd1l1
0.063
tmem38a
-0.021
mag
0.063
klhl31
-0.020
mast1a
0.062
XLOC-025819
-0.020