Daniocell
si:ch211-15d5.11 (muscle)
si:ch211-15d5.11
ZFIN
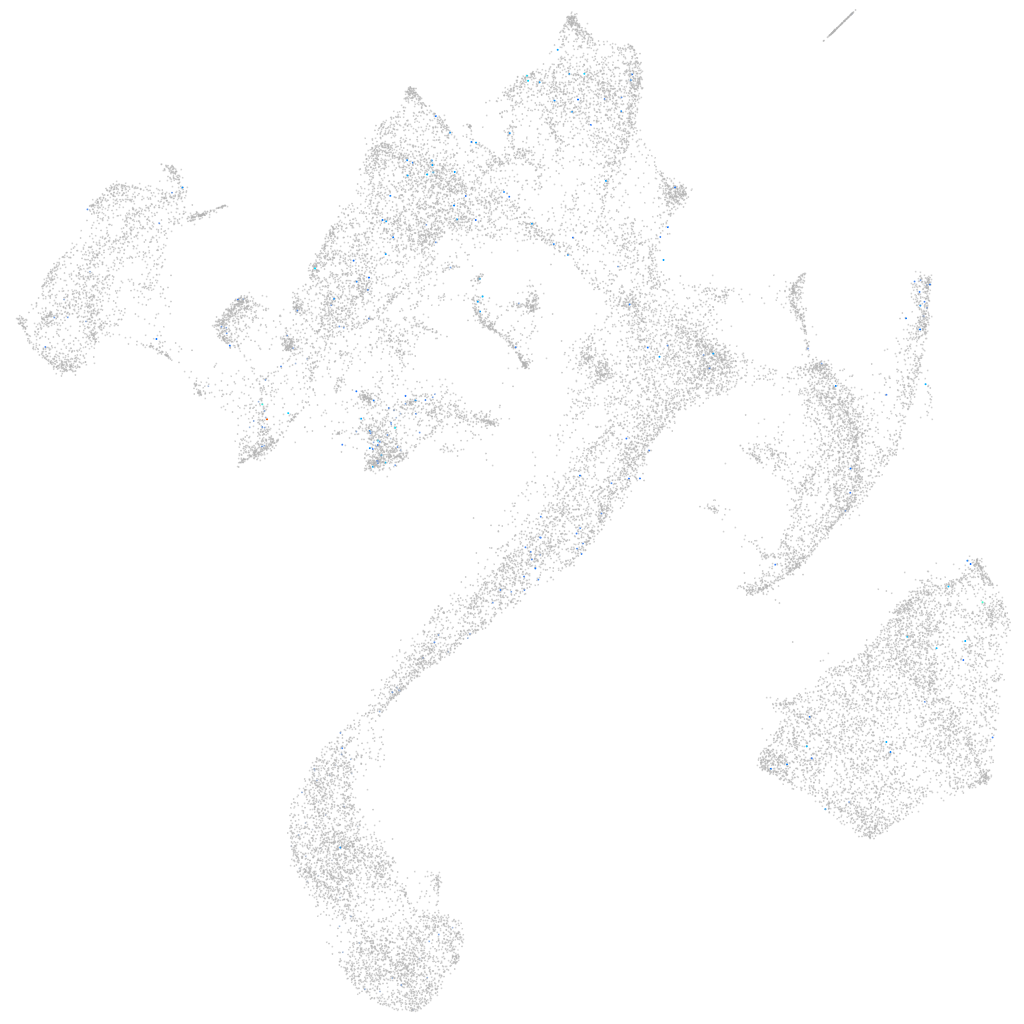
Gene expression UMAP
Display:
Expression
Stage
Other cell groups
all cells
blastomeres
PGCs
endoderm
axial mesoderm
muscle
mural cells /
non-skeletal muscle
mesenchyme
hematopoietic /
vasculature
pronephros
neural
spinal cord / glia
eye
taste / olfactory
otic / lateral line
epidermis
periderm
fin
ionocytes / mucous
pigment cells
Expression by stage/cluster
Correlated gene expression
Positive correlation
Negative correlation
Gene
r
Gene
r
LOC103908713
0.132
apoc1
-0.026
st18
0.117
apoeb
-0.026
CR354549.5
0.093
msgn1
-0.024
CU695215.2
0.093
hes6
-0.023
si:dkey-52p2.5
0.090
tbx16
-0.023
si:dkey-165o8.2
0.087
rbm38
-0.022
pimr80
0.083
cdx4
-0.022
LOC110440219
0.079
her7
-0.022
si:dkey-217f16.5
0.077
cdca8
-0.021
mhc1uka
0.076
tbxta
-0.021
lmx1a
0.072
cmtm6
-0.021
BX005407.1
0.072
cyp26a1
-0.020
CR769772.3
0.071
ndc80
-0.020
elavl4
0.068
tbx16l
-0.019
zgc:172270
0.065
znfl2a
-0.019
ggt1l2.1
0.065
dek
-0.019
LOC110439542
0.063
si:ch211-255p10.3
-0.019
cfap299
0.063
eif4ebp3l
-0.018
CR626962.1
0.062
depdc7a
-0.018
LOC108181943
0.061
wnt5b
-0.018
zdhhc22
0.061
ved
-0.018
BX569798.1
0.060
eve1
-0.018
mir206-2
0.059
ddx23
-0.018
LOC110439592
0.059
cdx1a
-0.018
stpg1
0.059
hoxb7a
-0.018
LOC101885930
0.057
carhsp1
-0.018
LOC108183671
0.057
mta3
-0.017
atp6ap1lb
0.057
dlgap5
-0.017
nrxn2a
0.056
vox
-0.017
LOC108180719
0.056
efnb2b
-0.017
slitrk5a
0.056
itm2cb
-0.017
obscna
0.055
ptgdsb.1
-0.017
si:ch73-379j16.2
0.055
pkmb
-0.017
XLOC-006609
0.055
LOC100008030
-0.017
fez1
0.054
notch1a
-0.017