Daniocell
si:ch211-15d5.11 (pronephros)
si:ch211-15d5.11
ZFIN
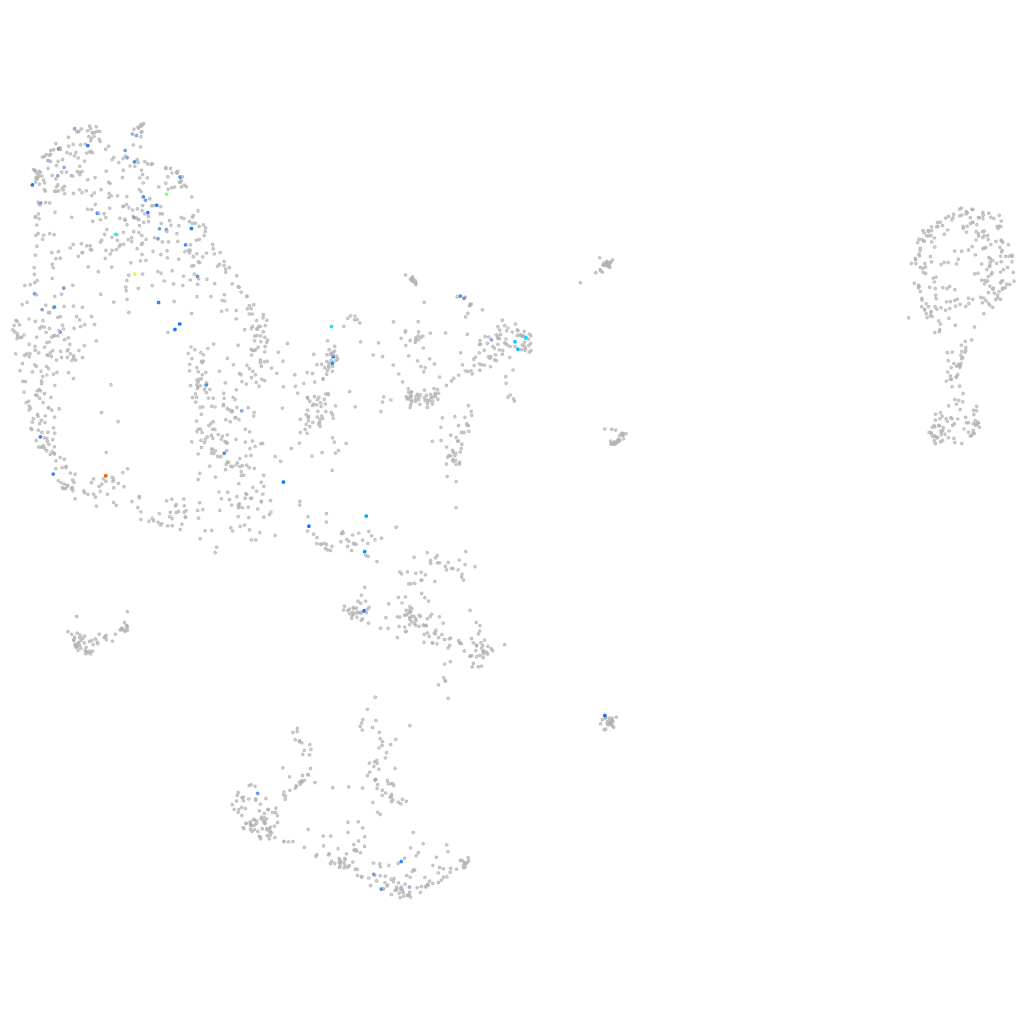
Gene expression UMAP
Display:
Expression
Stage
Other cell groups
all cells
blastomeres
PGCs
endoderm
axial mesoderm
muscle
mural cells /
non-skeletal muscle
mesenchyme
hematopoietic /
vasculature
pronephros
neural
spinal cord / glia
eye
taste / olfactory
otic / lateral line
epidermis
periderm
fin
ionocytes / mucous
pigment cells
Expression by stage/cluster
Correlated gene expression
Positive correlation
Negative correlation
Gene
r
Gene
r
si:ch211-276a17.5
0.397
rps7
-0.103
hspb11
0.388
si:ch211-222l21.1
-0.093
si:ch1073-184j22.2
0.337
h2afvb
-0.090
hbae5
0.307
rpl26
-0.088
dlgap1b
0.242
hmgb2a
-0.087
CABZ01072312.1
0.236
rps13
-0.086
ftr51
0.235
hmgn6
-0.085
si:ch211-269c21.2
0.229
rpl19
-0.082
casd1
0.227
ptmab
-0.080
AL590134.1
0.226
rpl23a
-0.078
trnS2
0.225
eif5a2
-0.078
XLOC-018373
0.224
hspb1
-0.077
XLOC-031633
0.222
rpl11
-0.076
hoxc1a
0.222
ube2e1
-0.073
wdr17
0.219
si:ch73-281n10.2
-0.072
CABZ01053748.1
0.216
pabpc1a
-0.071
lcat
0.216
bzw1b
-0.071
adcyap1r1b
0.215
snrpe
-0.071
hoxc12a
0.212
ran
-0.071
LOC110438054
0.212
h3f3d
-0.070
AL831726.1
0.209
sumo3a
-0.070
si:ch211-244a23.1
0.208
txnipa
-0.069
CABZ01079192.1
0.205
wu:fb97g03
-0.069
BEND4
0.205
hmgn2
-0.069
ntrk1
0.201
brd3a
-0.068
ank2a
0.197
si:ch73-1a9.3
-0.068
kif21a
0.197
anp32b
-0.068
kcnh1b
0.196
zgc:110425
-0.067
gja8a
0.195
ppig
-0.067
si:ch1073-450f2.1
0.195
khdrbs1a
-0.066
gfra2a
0.195
erh
-0.064
slc22a23
0.194
ddx23
-0.064
tmem150c
0.194
snrpd2
-0.063
trpc1
0.194
smc1al
-0.063
sez6a
0.191
eif3s6ip
-0.063