Daniocell
si:ch211-15d5.11 (fin)
si:ch211-15d5.11
ZFIN
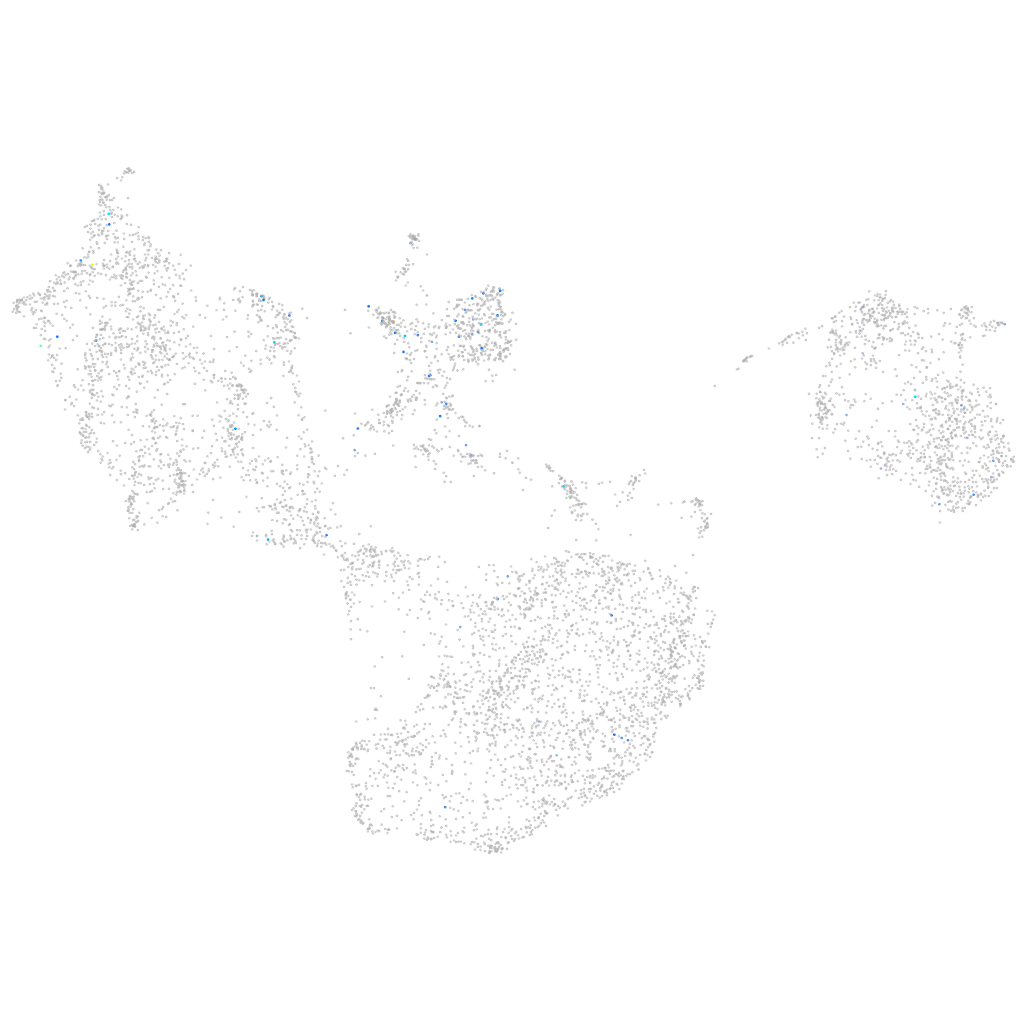
Gene expression UMAP
Display:
Expression
Stage
Other cell groups
all cells
blastomeres
PGCs
endoderm
axial mesoderm
muscle
mural cells /
non-skeletal muscle
mesenchyme
hematopoietic /
vasculature
pronephros
neural
spinal cord / glia
eye
taste / olfactory
otic / lateral line
epidermis
periderm
fin
ionocytes / mucous
pigment cells
Expression by stage/cluster
Correlated gene expression
Positive correlation
Negative correlation
Gene
r
Gene
r
gabra6b
0.365
s100a10b
-0.053
pcdh2ab2
0.319
si:dkey-151g10.6
-0.051
si:ch211-154e10.1
0.318
tmsb1
-0.051
CT583651.1
0.289
epcam
-0.049
si:ch211-156l18.8
0.265
cfl1l
-0.048
c8b
0.261
cldn1
-0.048
LOC101886078
0.257
spaca4l
-0.047
gdf3
0.250
zgc:92380
-0.046
slc34a1a
0.249
pfn1
-0.044
XLOC-021899
0.247
cldni
-0.043
si:ch211-276c2.2
0.247
tmsb4x
-0.043
dennd2db
0.237
cotl1
-0.042
ankrd6a
0.228
cdh1
-0.041
si:ch211-237i5.4
0.226
thy1
-0.040
sowahca
0.224
arhgef5
-0.040
wasf3a
0.216
anxa1a
-0.040
CABZ01076968.1
0.211
col18a1a
-0.040
AL590149.1
0.208
pak2a
-0.040
opn4xb
0.207
rpl37
-0.040
CABZ01090219.1
0.205
mcl1b
-0.040
nefla
0.202
rpl39
-0.040
slitrk4
0.202
capgb
-0.040
si:ch211-121j5.4
0.193
spint1a
-0.039
gdf9
0.189
si:dkey-16p21.8
-0.039
XLOC-044050
0.188
ecrg4b
-0.038
LOC108190755
0.188
si:dkey-102c8.3
-0.038
si:ch211-205a14.3
0.187
cyt1
-0.038
si:dkey-27l15.1
0.187
ahnak
-0.038
gpha2
0.186
csrp1a
-0.038
BX927122.2
0.181
rps21
-0.037
nrcama
0.180
gpa33a
-0.037
CR847906.1
0.179
rac2
-0.037
ca12
0.175
myl12.1
-0.037
igsf21b
0.172
si:ch1073-406l10.2
-0.037
rnf145a
0.172
lgals3b
-0.036