Daniocell
si:ch211-15d5.11 (blastomeres)
si:ch211-15d5.11
ZFIN
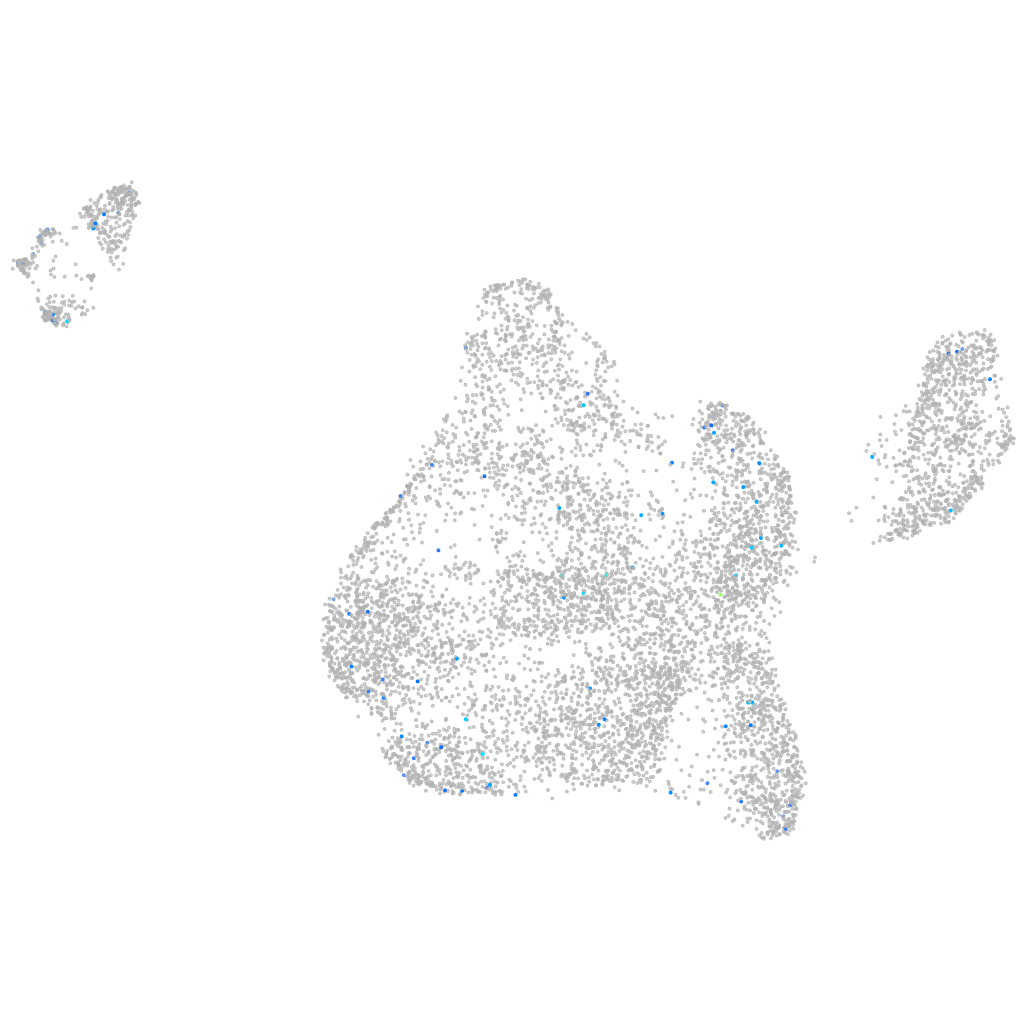
Gene expression UMAP
Display:
Expression
Stage
Other cell groups
all cells
blastomeres
PGCs
endoderm
axial mesoderm
muscle
mural cells /
non-skeletal muscle
mesenchyme
hematopoietic /
vasculature
pronephros
neural
spinal cord / glia
eye
taste / olfactory
otic / lateral line
epidermis
periderm
fin
ionocytes / mucous
pigment cells
Expression by stage/cluster
Correlated gene expression
Positive correlation
Negative correlation
Gene
r
Gene
r
LOC110438614
0.165
rps20
-0.038
cyp8b2
0.150
hmga1a
-0.038
CABZ01046996.1
0.142
rpl13a
-0.036
nyap2b
0.141
si:ch73-281n10.2
-0.036
CABZ01099795.1
0.136
hmgn6
-0.035
atoh7
0.131
si:ch211-276c2.4
-0.033
SPTBN4
0.125
h2afvb
-0.033
LOC110439420
0.117
si:ch73-1a9.3
-0.032
hoxc8a
0.116
anp32a
-0.031
si:ch73-306e8.2
0.116
morc3b
-0.031
CABZ01111454.1
0.112
apela
-0.030
XLOC-038343
0.110
rpl36
-0.030
si:dkey-17m8.2
0.109
si:dkey-151g10.6
-0.028
guca1c
0.107
knop1
-0.028
CT573429.2
0.106
hnrnpa0b
-0.028
LOC103910762
0.104
si:dkey-19e4.5
-0.028
LOC101882230
0.101
arf2a
-0.028
CABZ01064671.1
0.096
ybx1
-0.027
si:ch211-63p21.4
0.095
faua
-0.027
RNF122
0.094
khdrbs1a
-0.027
si:dkey-34d22.1
0.091
cdv3
-0.027
tmem30c
0.090
tcp1
-0.027
si:dkey-16b10.2
0.089
eif4bb
-0.027
AL840638.1
0.088
ptmab
-0.026
LOC108179621
0.088
shoc2
-0.026
lipt2
0.087
sec62
-0.026
stard4
0.086
si:ch211-284b7.3
-0.026
tmem158
0.086
foxd5
-0.026
LOC103911204
0.086
polr2k
-0.026
FP236513.1
0.085
mt-co1
-0.026
CU633933.1
0.084
atp5mf
-0.025
onecut3a
0.083
mbd3a
-0.025
si:ch73-221f6.3
0.083
ppp1r8b
-0.025
wnt10a
0.082
mthfd1b
-0.025
sdk2b
0.081
ddx18
-0.025