Daniocell
hesx1 (mesenchyme)
HESX homeobox 1
ZFIN
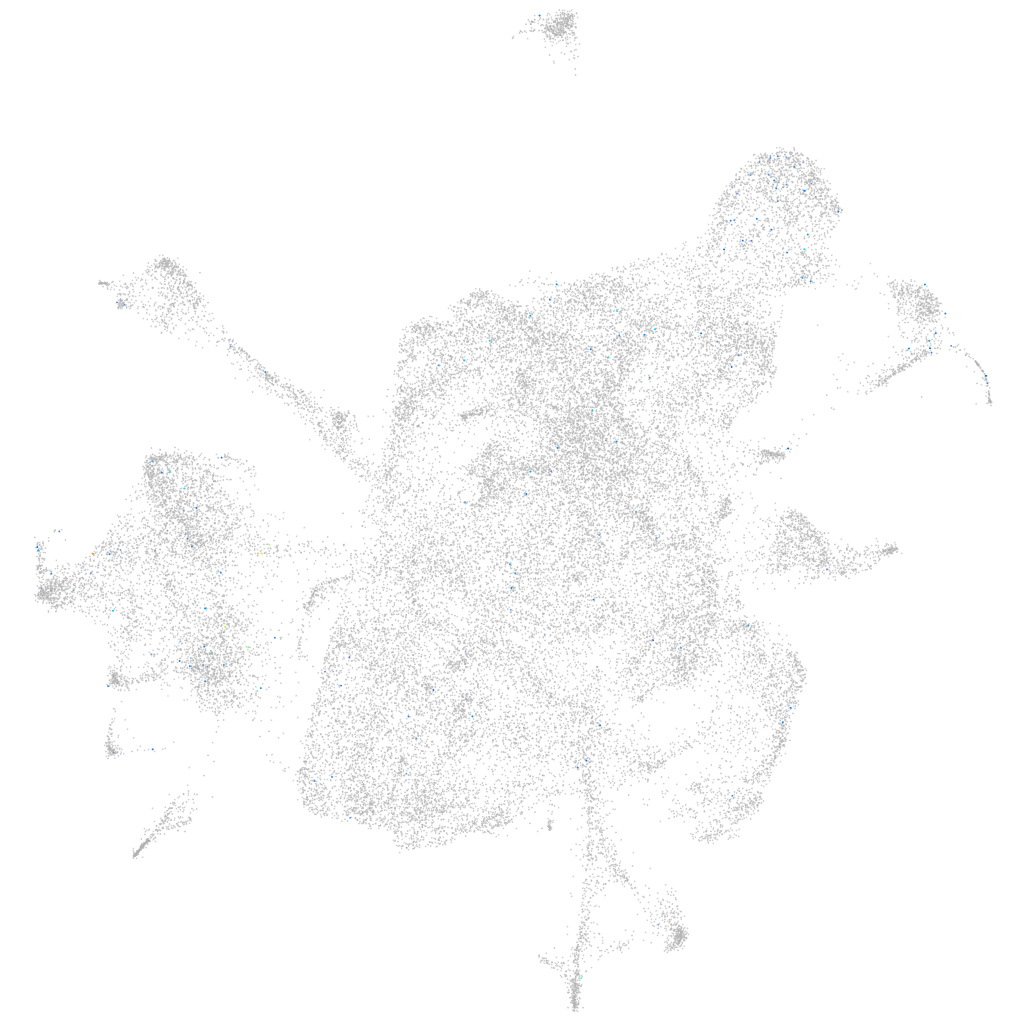
Gene expression UMAP
Display:
Expression
Stage
Other cell groups
all cells
blastomeres
PGCs
endoderm
axial mesoderm
muscle
mural cells /
non-skeletal muscle
mesenchyme
hematopoietic /
vasculature
pronephros
neural
spinal cord / glia
eye
taste / olfactory
otic / lateral line
epidermis
periderm
fin
ionocytes / mucous
pigment cells
Expression by stage/cluster
Correlated gene expression
Positive correlation
Negative correlation
Gene
r
Gene
r
zgc:65811
0.168
pmp22a
-0.017
prop1
0.129
twist1a
-0.016
si:ch211-195b15.7
0.111
dcn
-0.016
LO018205.3
0.084
lrrc17
-0.016
pimr176
0.080
si:ch211-286o17.1
-0.016
CABZ01004876.1
0.079
zfp36l1a
-0.015
RF00478
0.071
mab21l2
-0.014
capn3a
0.069
ahcy
-0.014
BX649434.1
0.069
rbp5
-0.014
si:ch73-368j24.3
0.066
olfml3b
-0.014
zgc:172215
0.060
CABZ01072614.1
-0.013
pimr131
0.060
gamt
-0.013
rimbp2
0.057
sept2
-0.013
XLOC-043690
0.056
marcksl1a
-0.013
ENKD1
0.055
ccnd1
-0.013
cdh30
0.054
tuba8l
-0.013
AL844185.1
0.053
mfap2
-0.013
LOC108179780
0.053
rps19
-0.013
CU459094.1
0.053
tpm4a
-0.012
gsg1l2a
0.052
gstt1a
-0.012
NC-002333.11
0.052
sept10
-0.012
FP102169.1
0.051
si:ch211-43f4.1
-0.012
drd1a
0.051
foxd1
-0.012
vip
0.050
col1a1b
-0.012
wnt7ab
0.049
cnn2
-0.012
LOC103908832
0.048
actb1
-0.012
CT573793.2
0.048
si:ch211-267e7.3
-0.012
XLOC-038255
0.047
rab8b
-0.012
kcna2a
0.047
col5a1
-0.012
eps8l2
0.047
rgmd
-0.012
LOC103909406
0.046
ism1
-0.012
XLOC-003052
0.046
rps29
-0.011
LOC110438662
0.046
ntn1a
-0.011
XLOC-043548
0.046
csde1
-0.011
hcn4l
0.045
erlin1
-0.011