Daniocell
hesx1 (otic / lateral line)
HESX homeobox 1
ZFIN
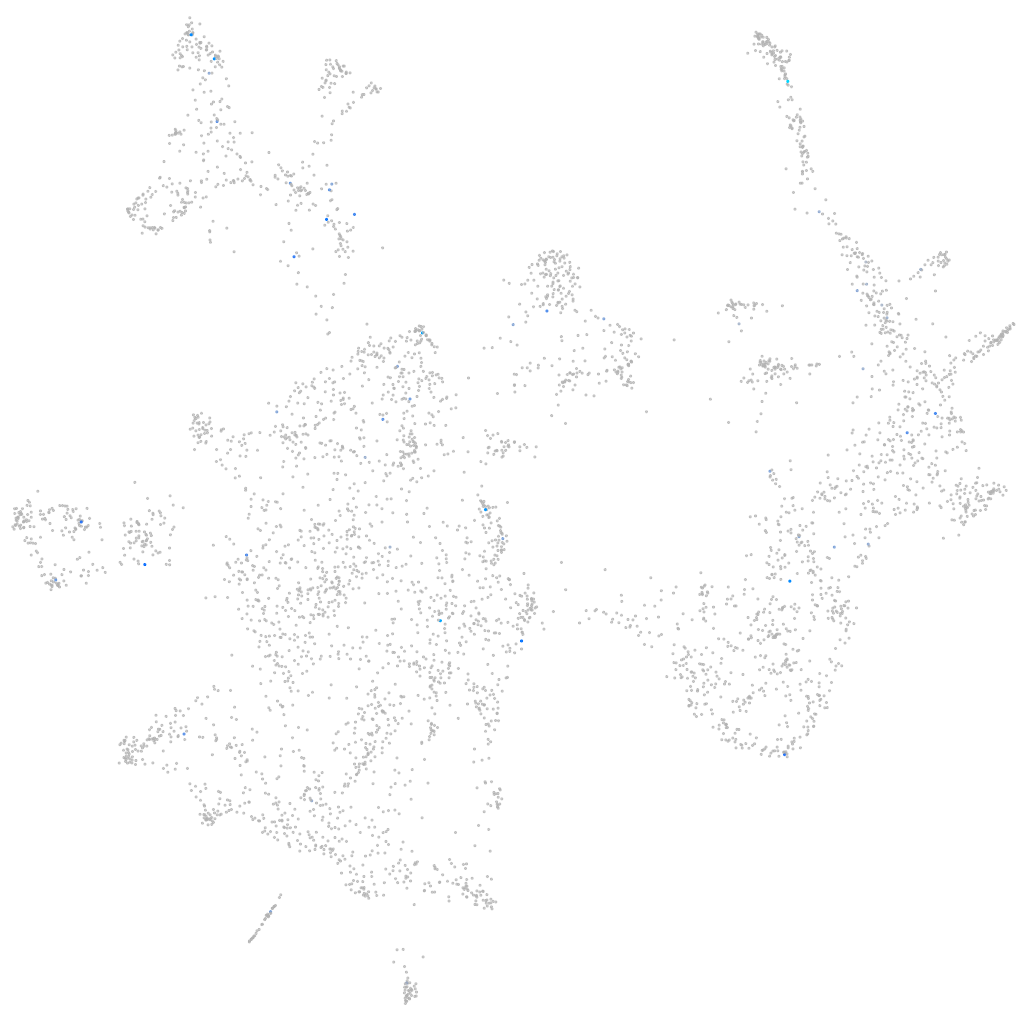
Gene expression UMAP
Display:
Expression
Stage
Other cell groups
all cells
blastomeres
PGCs
endoderm
axial mesoderm
muscle
mural cells /
non-skeletal muscle
mesenchyme
hematopoietic /
vasculature
pronephros
neural
spinal cord / glia
eye
taste / olfactory
otic / lateral line
epidermis
periderm
fin
ionocytes / mucous
pigment cells
Expression by stage/cluster
Correlated gene expression
Positive correlation
Negative correlation
Gene
r
Gene
r
tmem255b
0.267
rplp1
-0.046
CABZ01117603.1
0.253
rpl35
-0.043
tmem119a
0.228
rplp2l
-0.039
tbpl2
0.222
rpl31
-0.039
BX470188.1
0.218
rps29
-0.038
plrdgb
0.217
rps23
-0.036
TCERG1L
0.216
krt18a.1
-0.036
LOC110439422
0.210
col9a1b
-0.035
filip1a
0.207
rpl35a
-0.035
RF00190
0.181
matn4
-0.035
CABZ01030017.1
0.178
rpl11
-0.034
CT737162.1
0.177
rpl24
-0.033
CABZ01118575.1
0.177
si:ch73-1a9.3
-0.032
nkx2.5
0.170
fbxl6
-0.032
si:dkey-88n24.5
0.160
rps21
-0.032
ftr12
0.159
metrnla
-0.032
fscn2a
0.157
znf385a
-0.031
LOC103910017
0.157
rps28
-0.030
tbxtb
0.155
anxa3b
-0.030
spag16
0.154
nme2b.1
-0.030
si:dkeyp-118a3.2
0.153
tmsb4x
-0.030
XLOC-029890
0.152
rpl7a
-0.030
XLOC-025425
0.150
dag1
-0.030
LOC108191643.1
0.148
rps12
-0.030
CT030153.1
0.147
zgc:158463
-0.029
cyp2aa12
0.145
col2a1b
-0.029
adgre5b.2
0.140
col2a1a
-0.029
CR749763.6
0.137
rpl23
-0.029
si:dkey-97l20.6
0.135
si:ch211-156b7.4
-0.029
si:ch211-149a19.3
0.135
fzd7b
-0.028
nkx2.9
0.131
foxp4
-0.028
nxnl1
0.130
notch2
-0.028
mhc1zja
0.128
arpc5b
-0.028
tmem151a
0.128
chaf1a
-0.028
SPTBN4
0.127
ckma
-0.028