Daniocell
hesx1 (endoderm)
HESX homeobox 1
ZFIN
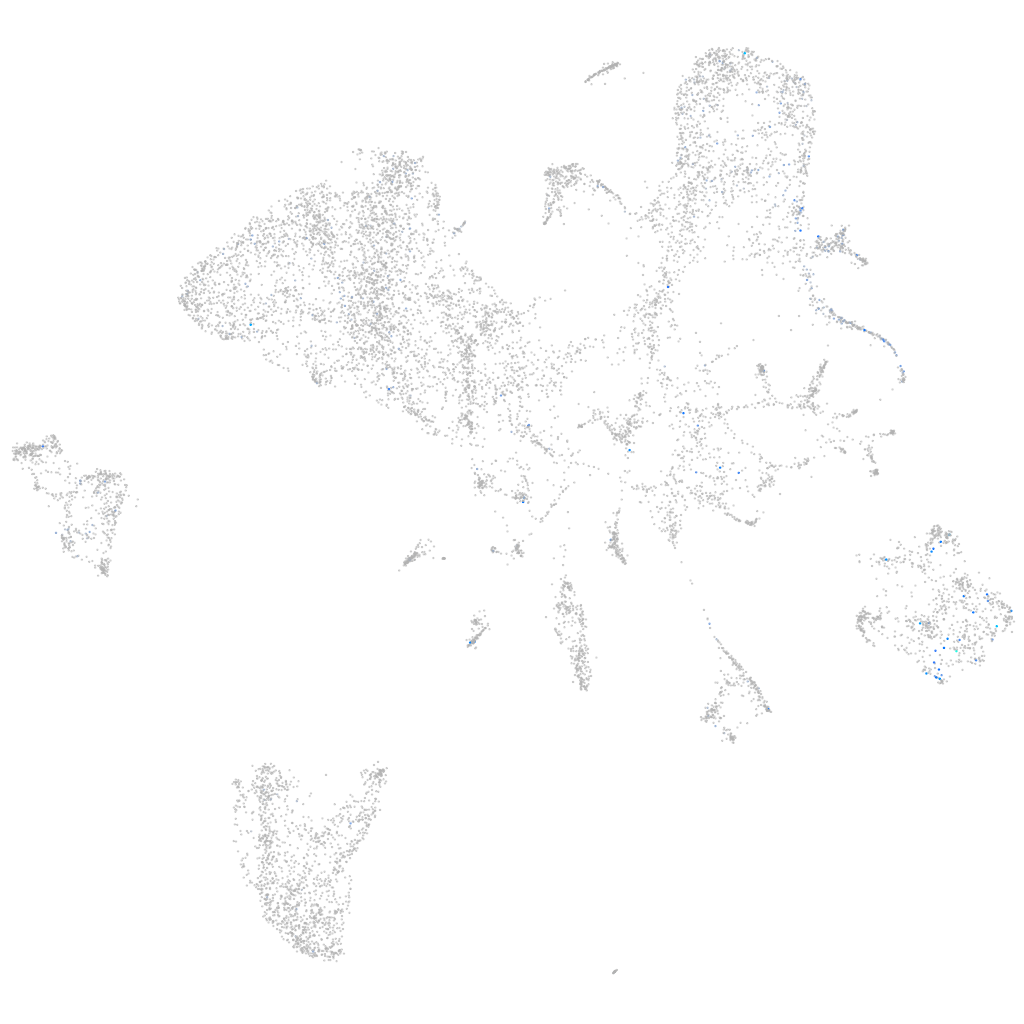
Gene expression UMAP
Display:
Expression
Stage
Other cell groups
all cells
blastomeres
PGCs
endoderm
axial mesoderm
muscle
mural cells /
non-skeletal muscle
mesenchyme
hematopoietic /
vasculature
pronephros
neural
spinal cord / glia
eye
taste / olfactory
otic / lateral line
epidermis
periderm
fin
ionocytes / mucous
pigment cells
Expression by stage/cluster
Correlated gene expression
Positive correlation
Negative correlation
Gene
r
Gene
r
XLOC-037016
0.242
aqp12
-0.062
BX649231.1
0.192
bhmt
-0.059
LOC103910779
0.192
rpl37
-0.054
LOC108183501
0.192
zgc:114188
-0.054
LOC103909625
0.188
rps10
-0.053
ccr12b.2
0.164
ahcy
-0.051
LOC108190994
0.159
zgc:92744
-0.049
admp
0.148
nupr1b
-0.049
LOC101882750
0.145
fabp3
-0.046
LOC110438671
0.143
gamt
-0.045
BX649294.1
0.133
apoa2
-0.045
FOXN2
0.130
ppdpfa
-0.045
XLOC-017410
0.129
agxtb
-0.044
si:dkey-182g1.6
0.128
kng1
-0.043
shisa2a
0.126
rtn1a
-0.043
fezf2
0.124
grhprb
-0.042
zgc:77752
0.119
gatm
-0.042
taar10
0.118
prdx4
-0.041
LOC103911482
0.118
prss1
-0.041
otx1
0.117
zgc:112160
-0.041
XLOC-041030
0.116
rps17
-0.040
LOC100537549
0.116
mat1a
-0.040
chrd
0.115
zgc:123103
-0.040
LOC110438679
0.114
ctrb1
-0.040
si:dkeyp-82a1.3
0.112
ela2
-0.040
zic2b
0.112
ctrl
-0.040
LOC108183612
0.110
CELA1 (1 of many)
-0.040
prdm14
0.110
cel.1
-0.040
CU928046.1
0.109
fep15
-0.040
tdgf1
0.109
sycn.2
-0.040
si:ch211-76l23.7
0.107
prss59.1
-0.040
LOC103911725
0.106
ela3l
-0.039
XLOC-001318
0.106
serpina1
-0.039
six7
0.105
prss59.2
-0.039
si:ch1073-80i24.3
0.104
cpa5
-0.039