Daniocell
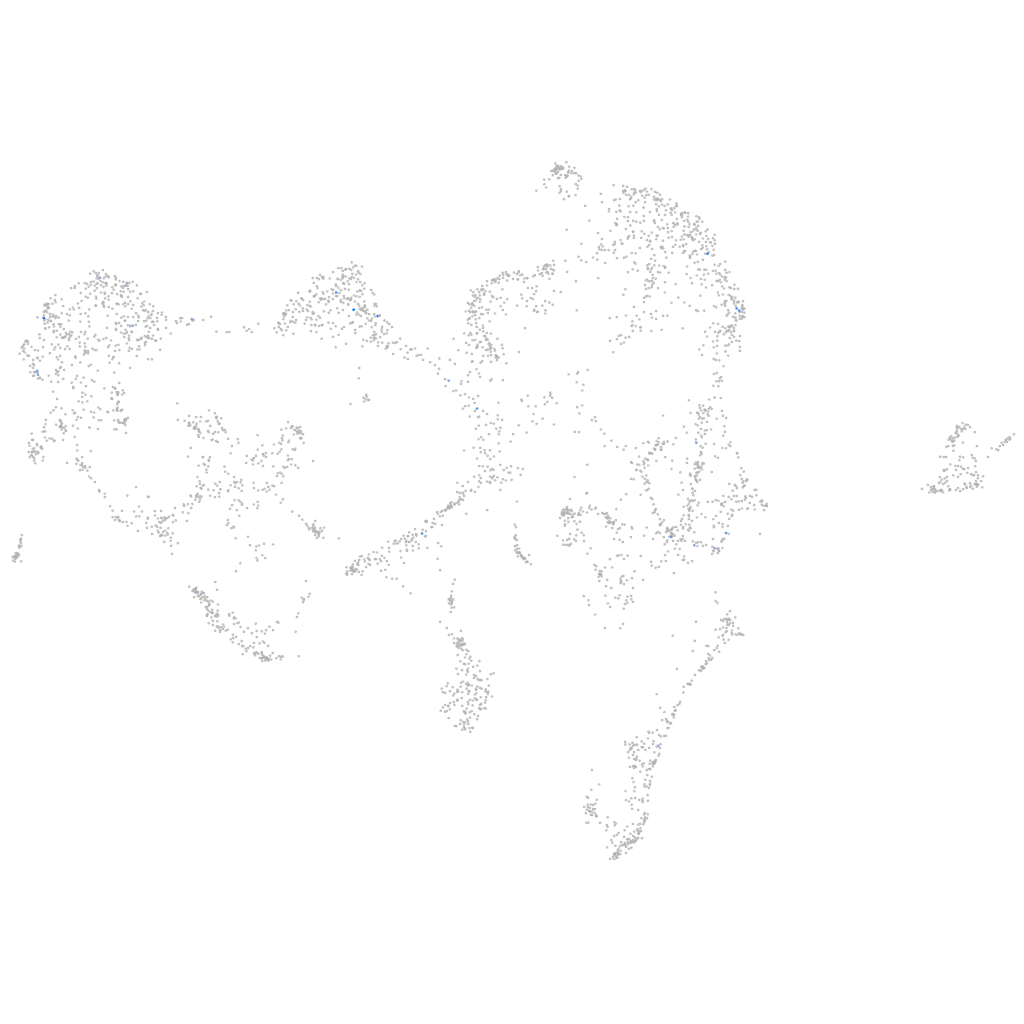
hesx1 (ionocytes / mucous-producing)
HESX homeobox 1
ZFIN
Gene expression UMAP
Display:
Expression
Stage
Other cell groups
all cells
blastomeres
PGCs
endoderm
axial mesoderm
muscle
mural cells /
non-skeletal muscle
mesenchyme
hematopoietic /
vasculature
pronephros
neural
spinal cord / glia
eye
taste / olfactory
otic / lateral line
epidermis
periderm
fin
ionocytes / mucous
pigment cells
Expression by stage/cluster
Correlated gene expression
Positive correlation
Negative correlation
Gene
r
Gene
r
LOC101883855
0.351
tmsb4x
-0.047
si:rp71-23d18.8
0.344
marcksl1a
-0.037
rimbp2
0.340
marcksl1b
-0.035
mex3c
0.278
ptmaa
-0.034
lrp1ba
0.274
prpf39
-0.031
BX255913.1
0.259
rac2
-0.031
XLOC-042561
0.259
sparc
-0.031
LOC101883867
0.240
lsp1
-0.030
gabra6a
0.238
march6
-0.029
cfap61
0.220
atp6v1f
-0.029
LOC103909620
0.213
sdc4
-0.029
nlrc9
0.213
si:dkey-151g10.6
-0.029
ftr03
0.212
FO082781.1
-0.029
si:ch211-255p10.4
0.197
scinla
-0.028
cabp5b
0.195
apoeb
-0.028
LOC103909809
0.191
aamp
-0.028
si:dkey-77f5.6
0.185
si:ch211-51e12.7
-0.028
gzm3
0.180
wdr45
-0.027
itga6l
0.179
cldni
-0.027
sall2
0.178
si:ch211-246m6.4
-0.027
si:ch73-233f7.1
0.176
uxt
-0.027
CABZ01075521.1
0.175
pan3
-0.027
CABZ01112864.1
0.175
acad8
-0.026
kcnq2a
0.170
her15.1
-0.026
myl7
0.167
her9
-0.026
znf1011
0.167
mycla
-0.026
zgc:161973
0.166
si:ch211-222l21.1
-0.026
LOC101884756
0.166
polr2k
-0.026
ak9
0.162
ywhae2
-0.026
BX649442.1
0.161
senp3a
-0.026
noxred1
0.161
mcm3
-0.026
XLOC-018968
0.160
fbxw11b
-0.025
FO744833.2
0.157
rpl38
-0.025
LOC101883668
0.152
CABZ01113192.1
-0.025
gsx2
0.152
acta1b
-0.025