Daniocell
fut10 (pronephros)
fucosyltransferase 10
ZFIN
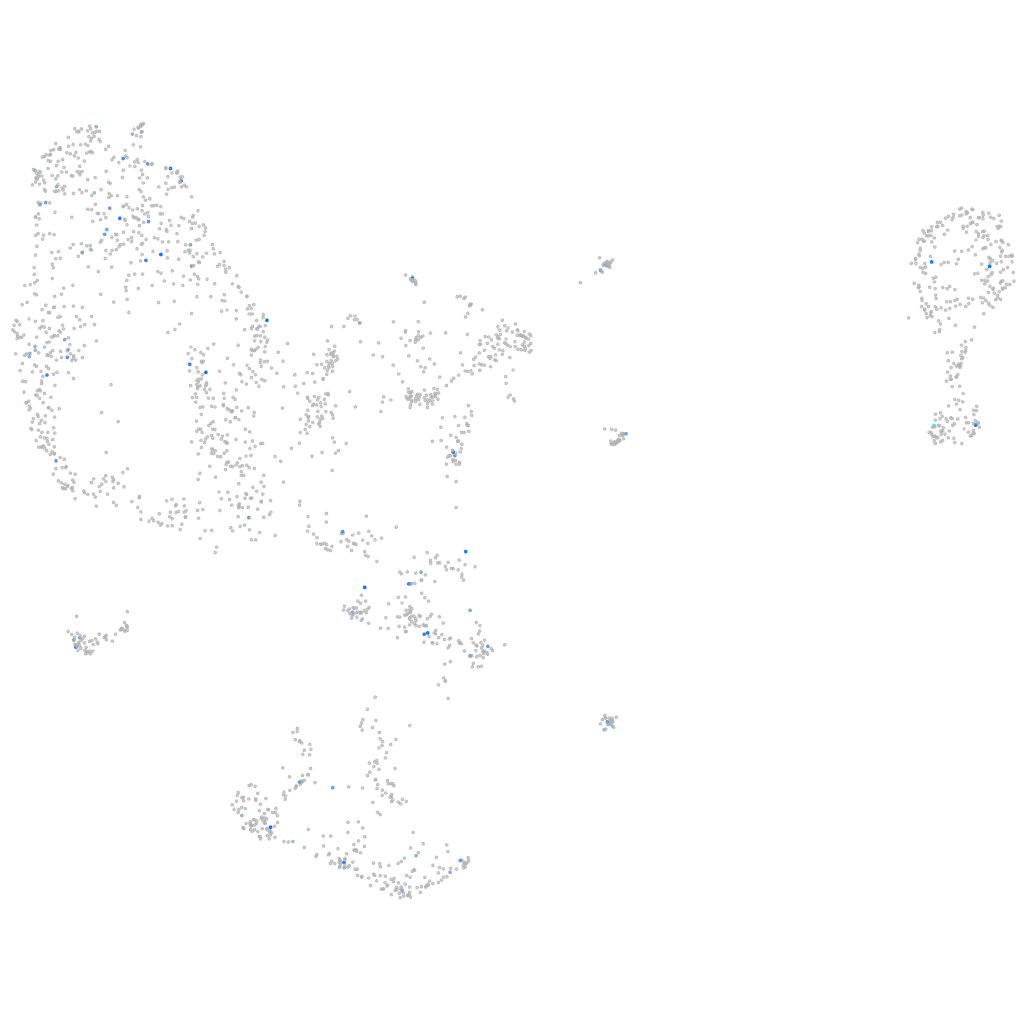
Gene expression UMAP
Display:
Expression
Stage
Other cell groups
all cells
blastomeres
PGCs
endoderm
axial mesoderm
muscle
mural cells /
non-skeletal muscle
mesenchyme
hematopoietic /
vasculature
pronephros
neural
spinal cord / glia
eye
taste / olfactory
otic / lateral line
epidermis
periderm
fin
ionocytes / mucous
pigment cells
Expression by stage/cluster
Correlated gene expression
Positive correlation
Negative correlation
Gene
r
Gene
r
si:dkey-16p19.1
0.359
marcksl1b
-0.048
LOC110438365
0.359
si:ch211-137a8.4
-0.045
LOC101884484
0.322
arglu1a
-0.043
LOC555502
0.322
hmha1a
-0.042
XLOC-014659
0.321
zic2b
-0.041
LOC110438490
0.254
h3f3c
-0.039
LOC110437817
0.252
hbbe3
-0.038
XLOC-002639
0.250
zgc:77849
-0.038
LOC101882770
0.247
hbae1.1
-0.038
LOC100537032
0.246
tbx16
-0.038
rerglb
0.237
fscn1a
-0.038
XLOC-029028
0.236
paox1
-0.037
si:dkey-121a9.3
0.219
pdcd6
-0.037
cacna1eb
0.215
ppp4ca
-0.037
XLOC-029505
0.214
serpinh1b
-0.036
nab2
0.192
ckbb
-0.036
LOC103911255
0.192
cxxc1b
-0.036
adad2
0.185
elavl3
-0.035
si:ch211-178n15.1
0.181
ssr1
-0.035
klhl23
0.179
ncoa5
-0.035
CU655961.2
0.179
si:dkey-43k4.3
-0.035
CR936416.1
0.178
gtf2a1
-0.035
fgf19
0.178
coro1cb
-0.034
LOC110437750
0.178
hmgb3a
-0.034
si:dkey-260c8.8
0.177
znf395a
-0.034
AL928920.3
0.173
ddx49
-0.034
CR589882.1
0.173
scoca
-0.034
AL954741.1
0.168
mylpfa
-0.034
XLOC-010908
0.168
rap1b
-0.034
CU633999.2
0.168
blf
-0.034
kncn
0.167
ubald2
-0.033
LOC101885430
0.167
setx
-0.033
XLOC-000367
0.165
si:ch211-152c2.3
-0.033
gnrhr2
0.164
hbbe1.2
-0.033
zgc:91849
0.161
si:ch73-311h14.2
-0.033