Daniocell
fut10 (glial cells / spinal cord)
fucosyltransferase 10
ZFIN
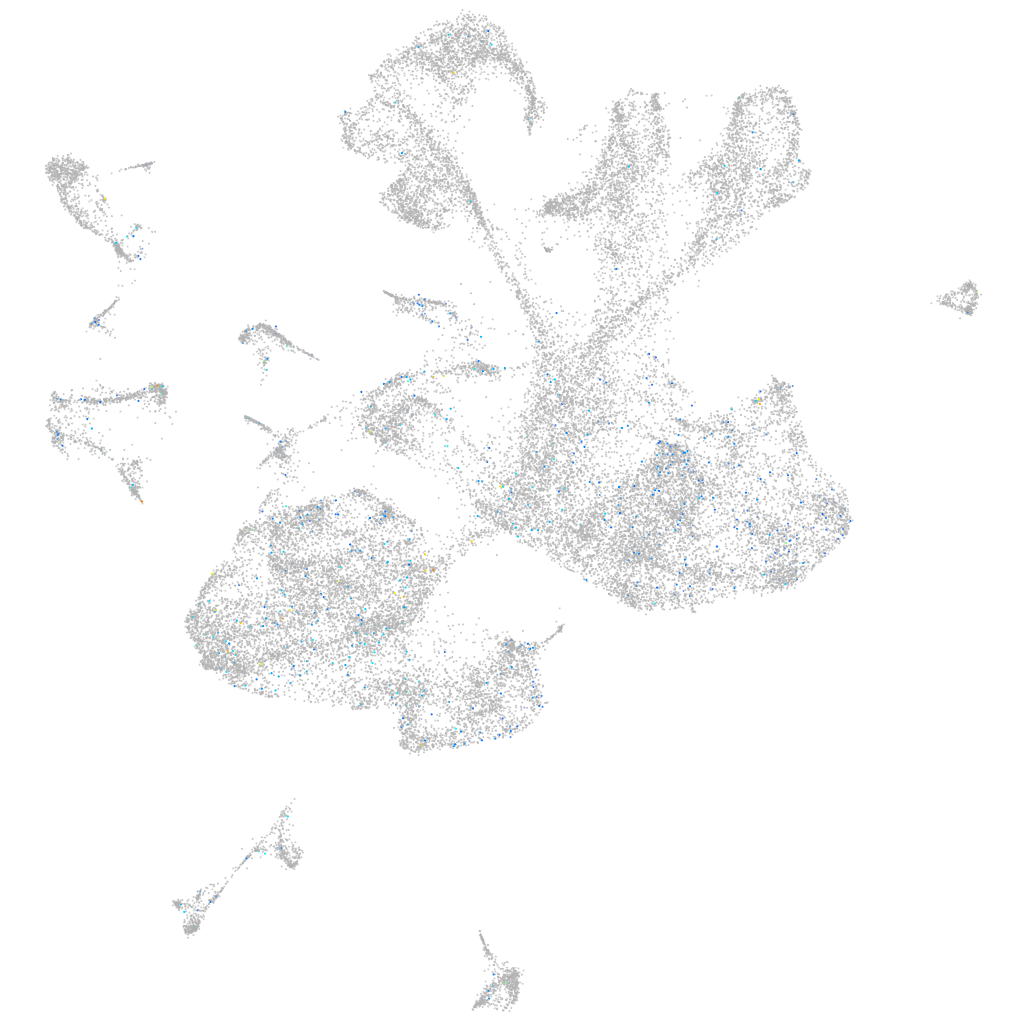
Gene expression UMAP
Display:
Expression
Stage
Other cell groups
all cells
blastomeres
PGCs
endoderm
axial mesoderm
muscle
mural cells /
non-skeletal muscle
mesenchyme
hematopoietic /
vasculature
pronephros
neural
spinal cord / glia
eye
taste / olfactory
otic / lateral line
epidermis
periderm
fin
ionocytes / mucous
pigment cells
Expression by stage/cluster
Correlated gene expression
Positive correlation
Negative correlation
Gene
r
Gene
r
si:ch211-271g18.4
0.073
elavl3
-0.047
si:ch211-11p18.6.1
0.072
myt1b
-0.043
SLC15A5
0.064
stx1b
-0.042
cxcr1
0.060
stxbp1a
-0.039
taar13b
0.057
gng3
-0.038
LOC100537163
0.055
rtn1b
-0.038
CR352263.1
0.053
snap25a
-0.037
si:ch211-198e20.10
0.052
sncb
-0.037
FQ976909.1
0.051
scrt2
-0.037
id1
0.048
rtn1a
-0.036
cd82a
0.048
stmn1b
-0.036
CU062645.1
0.047
atp6v0cb
-0.036
BX323458.2
0.046
nsg2
-0.036
notch3
0.046
gap43
-0.035
CABZ01113373.1
0.046
gng2
-0.035
CU694486.1
0.044
cplx2
-0.035
LOC101883144
0.044
ptmaa
-0.035
si:dkey-29d5.2
0.044
golga7ba
-0.034
jac1
0.044
elavl4
-0.034
gpm6bb
0.043
tmem59l
-0.034
msi1
0.043
stmn2a
-0.034
si:dkey-8e10.2
0.043
jagn1a
-0.033
si:dkey-261o4.8
0.042
syt2a
-0.033
vamp3
0.042
ube2ql1
-0.033
sox2
0.042
ywhah
-0.033
cldn5a
0.041
vamp2
-0.032
wls
0.041
pik3r3b
-0.032
si:dkey-29j8.3
0.041
ywhag2
-0.031
atp1b4
0.041
onecut1
-0.031
si:ch211-262h13.5
0.040
atcaya
-0.031
phgdh
0.040
zfhx3
-0.031
LOC101885930
0.040
tubb5
-0.031
XLOC-024493
0.039
adcyap1b
-0.031
GBGT1 (1 of many)
0.039
cplx2l
-0.030
XLOC-003690
0.039
LOC100537384
-0.030