Daniocell
fut10 (fin)
fucosyltransferase 10
ZFIN
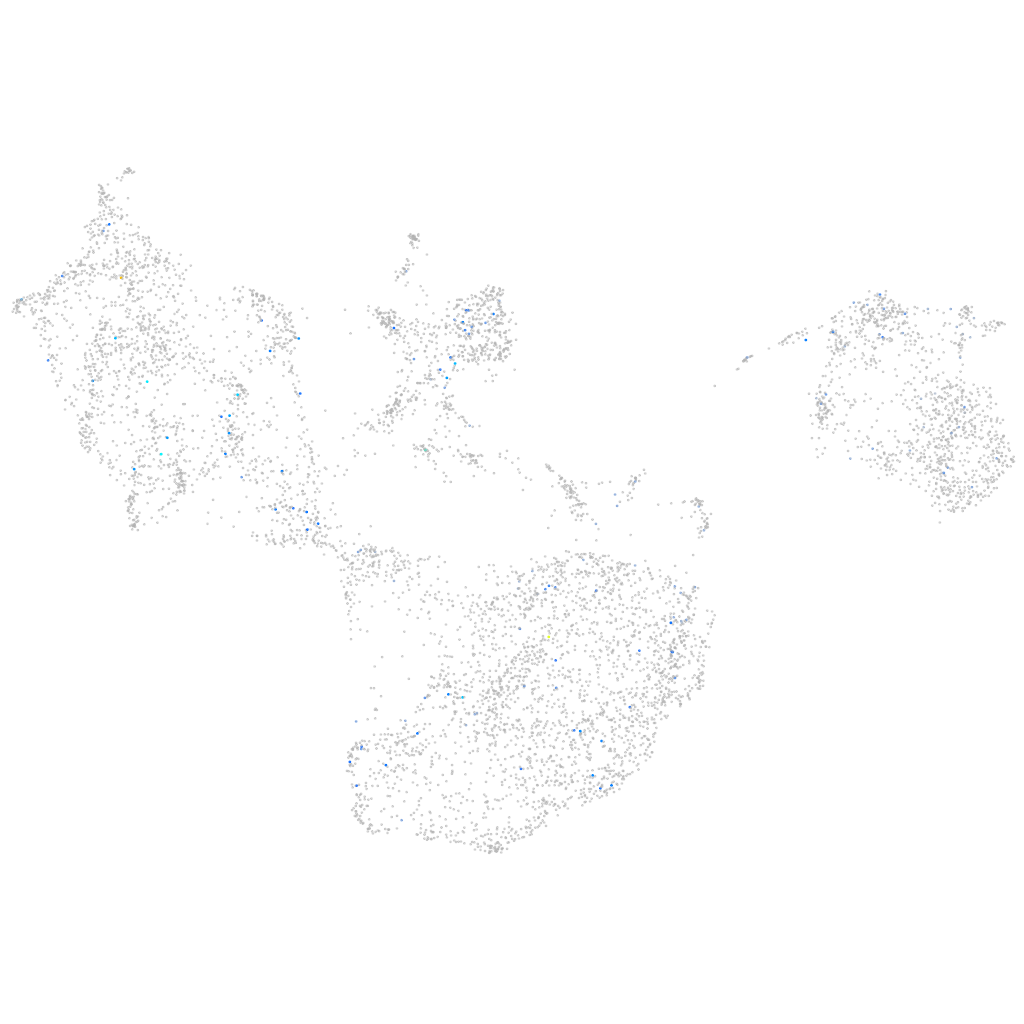
Gene expression UMAP
Display:
Expression
Stage
Other cell groups
all cells
blastomeres
PGCs
endoderm
axial mesoderm
muscle
mural cells /
non-skeletal muscle
mesenchyme
hematopoietic /
vasculature
pronephros
neural
spinal cord / glia
eye
taste / olfactory
otic / lateral line
epidermis
periderm
fin
ionocytes / mucous
pigment cells
Expression by stage/cluster
Correlated gene expression
Positive correlation
Negative correlation
Gene
r
Gene
r
xylb
0.209
ckma
-0.036
BX957318.1
0.159
ttn.2
-0.032
nod1
0.152
and1
-0.031
BX649434.2
0.152
hbbe1.1
-0.031
XLOC-013609
0.140
tpma
-0.031
LOC108180013
0.139
ube2al
-0.028
b4galt5
0.137
mylz3
-0.028
LOC101884052
0.132
s100v2
-0.026
XLOC-022751
0.131
npc2
-0.026
LOC108183743
0.129
cnot4b
-0.025
ttc29
0.128
trpm4a
-0.025
LOC101886167
0.126
inhbb
-0.025
zgc:172051
0.124
yes1
-0.024
pla1a
0.122
and3
-0.024
si:dkey-47k20.8
0.119
ilk
-0.023
pacs2
0.115
nupr1a
-0.023
CU639471.1
0.110
si:dkey-17o15.2
-0.023
ppp2r2cb
0.110
and2
-0.023
ccl35.1
0.108
tlk1a
-0.023
FP103009.1
0.107
selenow1
-0.023
zp2l2
0.105
wu:fb18f06
-0.023
kansl1l
0.105
hbbe1.2
-0.022
fam57bb
0.104
zgc:92140
-0.022
CABZ01035279.1
0.103
im:7150988
-0.022
LOC103911551
0.103
pvalb2
-0.022
XLOC-020173
0.103
mir22a
-0.022
CABZ01065684.1
0.100
slc27a1b
-0.022
CR848736.1
0.100
lzts1
-0.022
klhl42
0.099
erlec1
-0.021
rxfp1
0.098
znf185
-0.021
si:dkey-8e10.3
0.096
rngtt
-0.021
LOC103911838
0.095
si:ch73-91k6.2
-0.021
pde1a
0.095
dkk1b
-0.021
XLOC-017424
0.094
zgc:77262
-0.021
si:dkey-6a5.3
0.094
styx
-0.021