Daniocell
fut10 (periderm)
fucosyltransferase 10
ZFIN
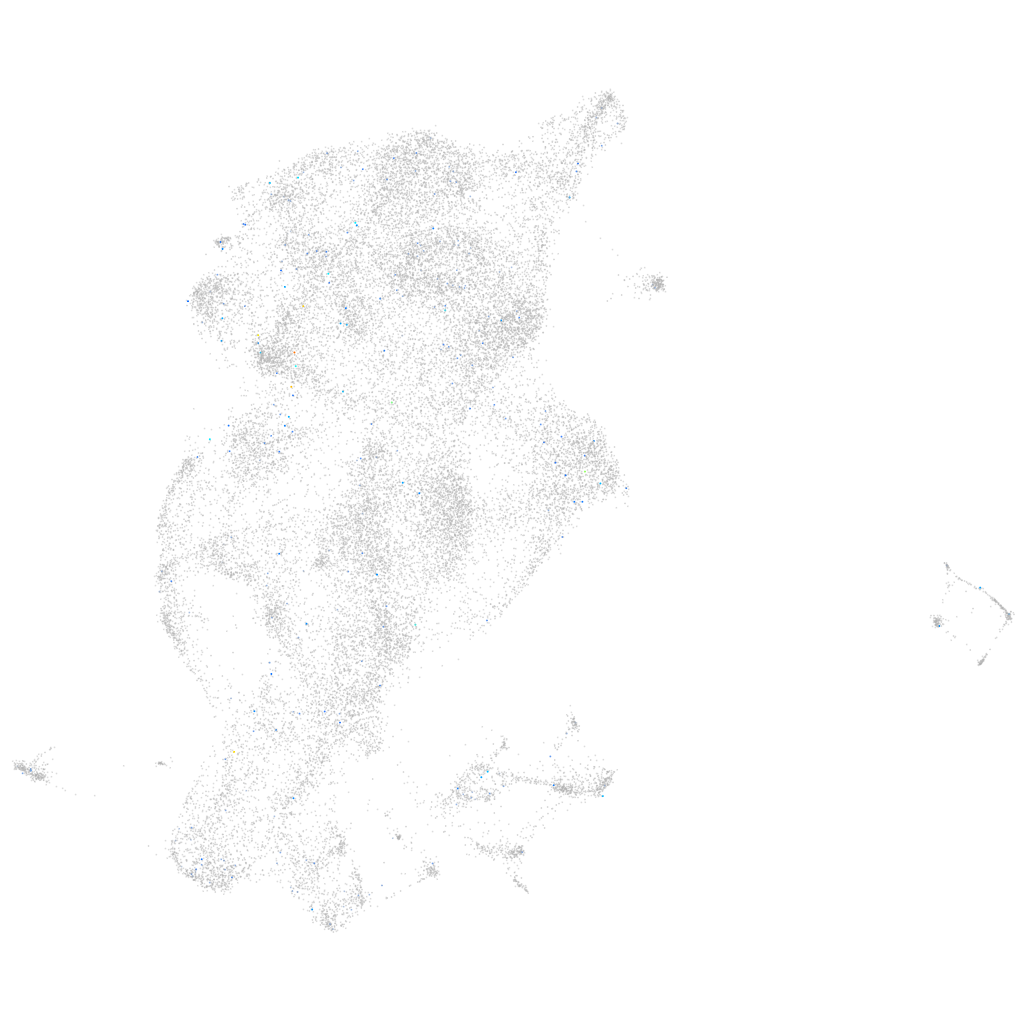
Gene expression UMAP
Display:
Expression
Stage
Other cell groups
all cells
blastomeres
PGCs
endoderm
axial mesoderm
muscle
mural cells /
non-skeletal muscle
mesenchyme
hematopoietic /
vasculature
pronephros
neural
spinal cord / glia
eye
taste / olfactory
otic / lateral line
epidermis
periderm
fin
ionocytes / mucous
pigment cells
Expression by stage/cluster
Correlated gene expression
Positive correlation
Negative correlation
Gene
r
Gene
r
LOC103911653
0.201
agr1
-0.032
hnf4a
0.171
icn2
-0.031
sbk3
0.155
zgc:193505
-0.031
XLOC-029423
0.153
wu:fb18f06
-0.030
XLOC-002411
0.152
cyt1l
-0.029
apbb1ip
0.124
cst14b.1
-0.026
col5a3b
0.118
zgc:175088
-0.025
stk38b
0.115
icn
-0.025
ddr2l
0.114
anxa1a
-0.023
CABZ01113815.1
0.113
si:ch211-195b11.3
-0.023
zmp:0000000711
0.113
cyt1
-0.023
si:ch73-41e3.7
0.112
krt4
-0.023
znf1108
0.112
XLOC-041945
-0.022
dpyda.3
0.109
rtn3
-0.021
LOC110438054
0.106
tcnbb
-0.020
si:ch73-173h19.3
0.104
ckap4
-0.019
CABZ01109481.1
0.101
s100a10b
-0.019
XLOC-011211
0.099
cfl1l
-0.019
ngfa
0.094
zgc:153284
-0.019
hcn4
0.094
aep1
-0.018
XLOC-044166
0.094
fut9d
-0.017
tmem206
0.092
gsta.1
-0.017
agxt2
0.092
si:dkeyp-86h10.3
-0.017
si:ch211-196h16.12
0.088
si:dkey-16p21.8
-0.017
limk1a
0.087
anxa1c
-0.016
BX005085.6
0.086
krt5
-0.016
XLOC-023594
0.083
capns1a
-0.016
zgc:174719
0.082
tmsb1
-0.015
slc9a3.2
0.082
zgc:163030
-0.015
mybpc2a
0.080
scel
-0.015
si:dkey-247m21.3
0.078
si:ch211-202f3.3
-0.015
CU468917.1
0.078
ttc1
-0.014
CU929240.1
0.075
si:dkey-74k8.3
-0.014
eif2b5
0.072
ssr4
-0.014
XLOC-043847
0.072
evplb
-0.014