Daniocell
fut10 (hematopoietic / vasculature)
fucosyltransferase 10
ZFIN
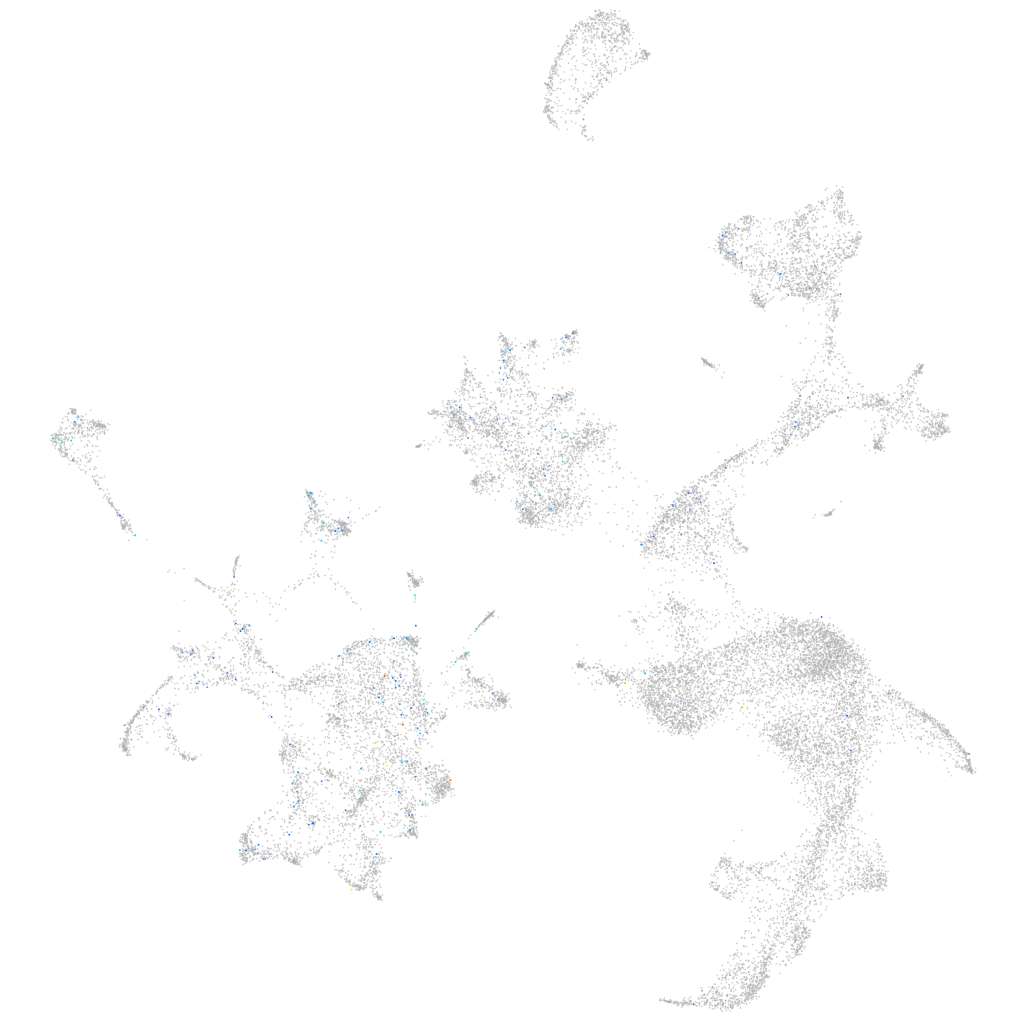
Gene expression UMAP
Display:
Expression
Stage
Other cell groups
all cells
blastomeres
PGCs
endoderm
axial mesoderm
muscle
mural cells /
non-skeletal muscle
mesenchyme
hematopoietic /
vasculature
pronephros
neural
spinal cord / glia
eye
taste / olfactory
otic / lateral line
epidermis
periderm
fin
ionocytes / mucous
pigment cells
Expression by stage/cluster
Correlated gene expression
Positive correlation
Negative correlation
Gene
r
Gene
r
XLOC-029657
0.144
hbae1.1
-0.050
XLOC-003642
0.135
hbbe1.3
-0.049
CU856423.1
0.134
hbae3
-0.048
LOC110438149
0.133
cahz
-0.048
taar18d
0.108
hbae1.3
-0.047
taar20z
0.100
alas2
-0.046
FO834800.1
0.098
hbbe2
-0.046
LOC103911517
0.096
hbbe1.2
-0.044
LOC108179594
0.094
hbbe1.1
-0.042
mir338-2
0.094
blvrb
-0.042
znf1166
0.093
zgc:163057
-0.042
pimr48
0.088
hemgn
-0.040
BX324202.1
0.087
si:ch211-207c6.2
-0.038
si:ch211-106j21.4
0.083
nt5c2l1
-0.038
grin3ba
0.080
tspo
-0.036
si:dkeyp-85h7.1
0.079
hbae5
-0.035
LOC110438160
0.077
creg1
-0.034
XLOC-041980
0.076
plac8l1
-0.034
zgc:64201
0.075
prdx2
-0.034
XLOC-015908
0.075
zgc:56095
-0.032
XLOC-019884
0.074
hbbe3
-0.031
LOC103910136
0.073
slc4a1a
-0.031
si:ch73-106l15.2
0.073
si:ch211-250g4.3
-0.031
lfng
0.071
epb41b
-0.031
CABZ01057496.1
0.070
si:dkey-240n22.3
-0.030
zgc:162879
0.070
ucp3
-0.029
LOC101886442
0.069
tmod4
-0.029
id1
0.069
tubb1
-0.028
CABZ01002702.1
0.068
add2
-0.027
LOC103910313
0.066
gpx1a
-0.027
asic1a
0.066
nmt1b
-0.026
zfp36l1b
0.065
gp1bb
-0.025
fam174b
0.065
fth1a
-0.025
si:ch1073-184j22.2
0.065
hif1al2
-0.025
cpn1
0.065
rhd
-0.024