Daniocell
fut10 (muscle)
fucosyltransferase 10
ZFIN
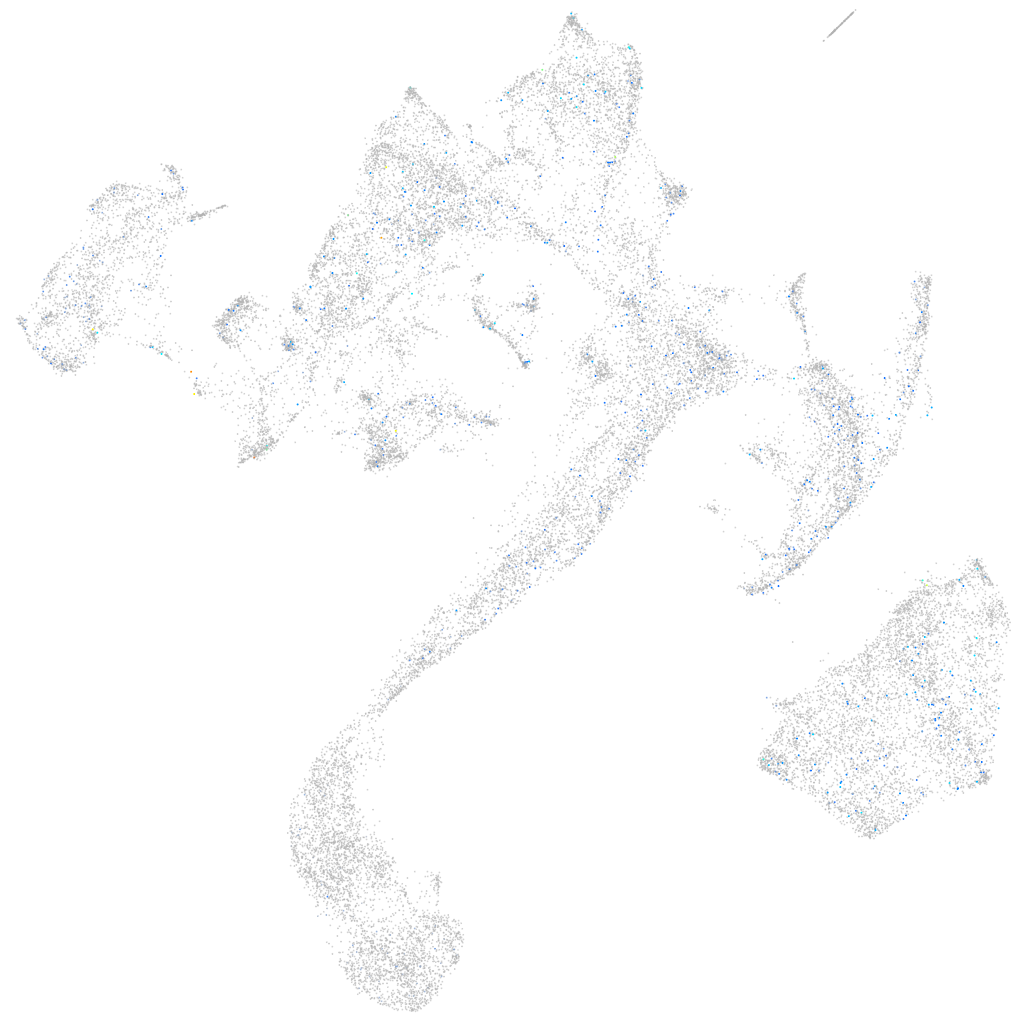
Gene expression UMAP
Display:
Expression
Stage
Other cell groups
all cells
blastomeres
PGCs
endoderm
axial mesoderm
muscle
mural cells /
non-skeletal muscle
mesenchyme
hematopoietic /
vasculature
pronephros
neural
spinal cord / glia
eye
taste / olfactory
otic / lateral line
epidermis
periderm
fin
ionocytes / mucous
pigment cells
Expression by stage/cluster
Correlated gene expression
Positive correlation
Negative correlation
Gene
r
Gene
r
si:rp71-17i16.5
0.138
tnnc2
-0.047
CR749762.1
0.133
myl1
-0.047
BX927363.1
0.117
mylz3
-0.047
ankrd63
0.115
tpma
-0.047
opn7b
0.111
actc1b
-0.046
si:dkey-225f23.4
0.110
mylpfb
-0.045
LOC101885809
0.109
tnni2a.4
-0.045
BX323596.2
0.096
acta1b
-0.045
btr33
0.087
slc25a4
-0.044
XLOC-044229
0.084
mylpfa
-0.044
si:ch211-266g18.9
0.076
myom2a
-0.044
CR855274.1
0.071
hhatla
-0.043
CABZ01024499.1
0.070
rtn2a
-0.043
CR786576.1
0.067
gamt
-0.043
AL845330.1
0.066
mybphb
-0.043
stum
0.065
pvalb2
-0.043
CR318588.1
0.063
ckma
-0.042
pde8b
0.062
pvalb1
-0.042
zgc:136333
0.062
tmem38a
-0.041
guca1d
0.061
CABZ01061524.1
-0.041
zgc:158412
0.061
CABZ01078594.1
-0.041
zgc:175280
0.060
tnnt3a
-0.041
scn4aa
0.060
myoz1b
-0.041
pcdh2g6
0.059
ak1
-0.041
or109-2
0.058
tnnt3b
-0.041
frmd3
0.056
si:ch73-367p23.2
-0.040
nlgn4xb
0.055
tmod4
-0.040
CU459012.3
0.053
myhz1.3
-0.040
sod3b
0.053
ckmb
-0.040
CABZ01088864.1
0.051
pabpc4
-0.040
LOC101884375
0.051
smyd1a
-0.039
BX000522.1
0.050
ryr3
-0.039
CABZ01113981.1
0.048
actn3a
-0.039
LOC100332582
0.048
ldb3b
-0.038
AL928650.2
0.048
hacd1
-0.038