Daniocell
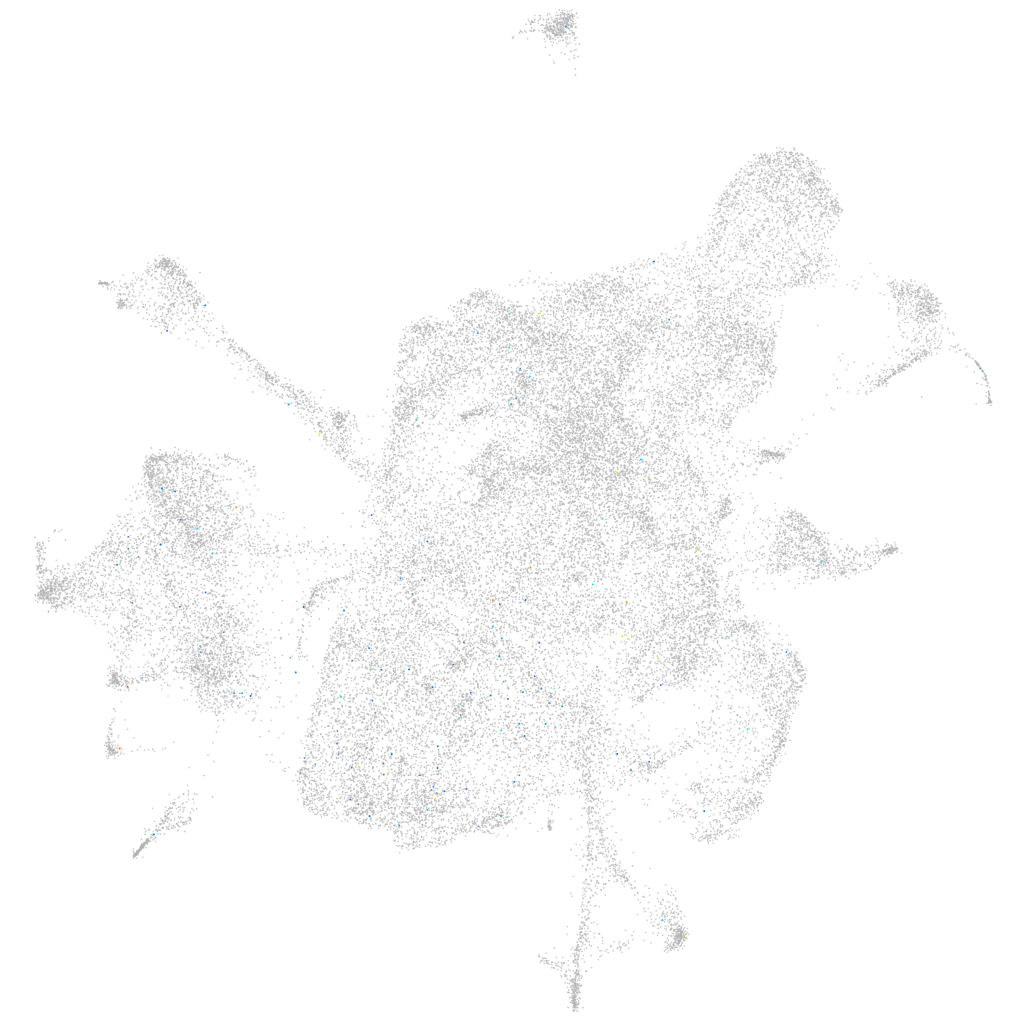
CABZ01043953.1.1 (mesenchyme)
Gene expression UMAP
Display:
Expression
Stage
Other cell groups
all cells
blastomeres
PGCs
endoderm
axial mesoderm
muscle
mural cells /
non-skeletal muscle
mesenchyme
hematopoietic /
vasculature
pronephros
neural
spinal cord / glia
eye
taste / olfactory
otic / lateral line
epidermis
periderm
fin
ionocytes / mucous
pigment cells
Expression by stage/cluster
Correlated gene expression
Positive correlation
Negative correlation
Gene
r
Gene
r
BX927234.1
0.116
rpl19
-0.026
zgc:171501
0.113
rpl27a
-0.023
BX294383.2
0.099
rpl21
-0.022
LOC101884484
0.099
vdac3
-0.022
CABZ01041494.1
0.097
rpl36a
-0.021
LOC110439999
0.095
mxra8b
-0.021
pcdh2aa15
0.094
rpl28
-0.021
si:ch211-63b16.3
0.094
wu:fb55g09
-0.020
si:ch73-379f7.4
0.090
selenow1
-0.019
LOC103910614
0.088
zgc:92744
-0.019
cldnj
0.076
eef1da
-0.019
kcnb2
0.074
rplp1
-0.019
ak8
0.071
gabarapb
-0.019
her3
0.071
tpt1
-0.019
BX004780.1
0.071
dap1b
-0.019
LOC100007966
0.070
lxn
-0.019
adgre13
0.068
ppdpfb
-0.018
si:ch1073-155h21.2
0.068
rpl22
-0.018
mxtx1
0.067
zgc:162730
-0.018
CABZ01033540.1
0.065
rps21
-0.018
si:ch211-238p8.24
0.065
rps23
-0.018
BX927253.3
0.064
rpl38
-0.018
si:ch211-222n4.2
0.064
rpl17
-0.017
si:dkey-92j16.2
0.060
sparc
-0.017
zpcx
0.056
romo1
-0.017
tbata
0.055
rps13
-0.017
XLOC-024725
0.054
VIT
-0.017
CT573003.1
0.052
faua
-0.017
LOC103908725
0.051
rps2
-0.017
LOC108191042
0.050
srpx
-0.016
chrnb1l
0.050
tspan4a
-0.016
FQ377918.1
0.050
sat1a.2
-0.016
si:ch211-155m12.5
0.050
fgfbp2b
-0.016
CT573793.2
0.049
rps24
-0.016
si:ch211-265g22.4
0.048
col9a1a
-0.016