Daniocell
CABZ01043953.1.1 (hematopoietic / vasculature)
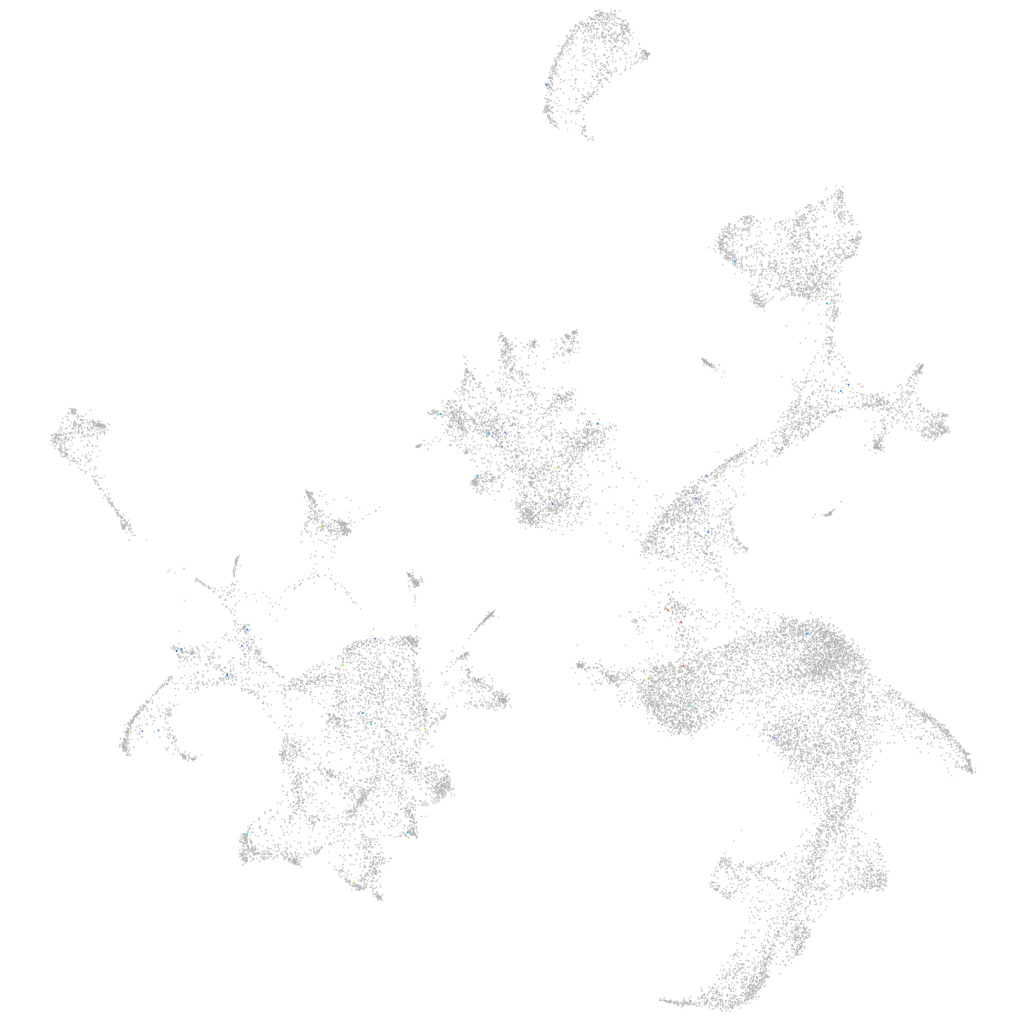
Gene expression UMAP
Display:
Expression
Stage
Other cell groups
all cells
blastomeres
PGCs
endoderm
axial mesoderm
muscle
mural cells /
non-skeletal muscle
mesenchyme
hematopoietic /
vasculature
pronephros
neural
spinal cord / glia
eye
taste / olfactory
otic / lateral line
epidermis
periderm
fin
ionocytes / mucous
pigment cells
Expression by stage/cluster
Correlated gene expression
Positive correlation
Negative correlation
Gene
r
Gene
r
si:ch211-241e1.3
0.205
alas2
-0.020
dlk2
0.195
nmt1b
-0.016
XLOC-042570
0.180
ap2m1a
-0.016
gckr
0.170
tmod4
-0.016
taar14h
0.170
TCIM (1 of many)
-0.016
BX248121.1
0.160
blvrb
-0.015
tmem264
0.141
sptb
-0.015
LOC110440024
0.138
fam53b
-0.014
BX248089.1
0.138
bloc1s6
-0.014
XLOC-023761
0.131
tmem59
-0.014
si:ch211-161h7.8
0.126
rabgap1l
-0.014
CABZ01085887.1
0.114
vps4b
-0.013
RF00421
0.114
b4galt1l
-0.013
irs4a
0.111
zgc:163057
-0.013
fam151a
0.110
guk1a
-0.013
XLOC-007147
0.109
cfl1l
-0.013
XLOC-042220
0.108
nt5c2l1
-0.013
or125-5
0.105
mibp2
-0.012
pcdh1gb2
0.102
irf2
-0.012
paplnb
0.099
hif1al2
-0.012
LOC110439617
0.099
cops2
-0.012
si:ch211-223g7.6
0.099
adrb3a
-0.012
tlr7
0.096
ucp3
-0.012
LOC100332639
0.091
hbbe3
-0.012
hspb9
0.091
tmem14ca
-0.012
XLOC-008708
0.089
crema
-0.012
LOC103909772
0.088
clgn
-0.012
LOC103911092
0.087
commd4
-0.012
LOC110439328
0.086
tbca
-0.011
XLOC-000449
0.086
nupr1a
-0.011
XLOC-044286
0.083
fthl31
-0.011
FP102018.1
0.081
prdx2
-0.011
CR812470.2
0.081
cbr1l
-0.011
zmp:0000001175
0.079
mef2aa
-0.011
elavl2
0.075
dll4
-0.011