Daniocell
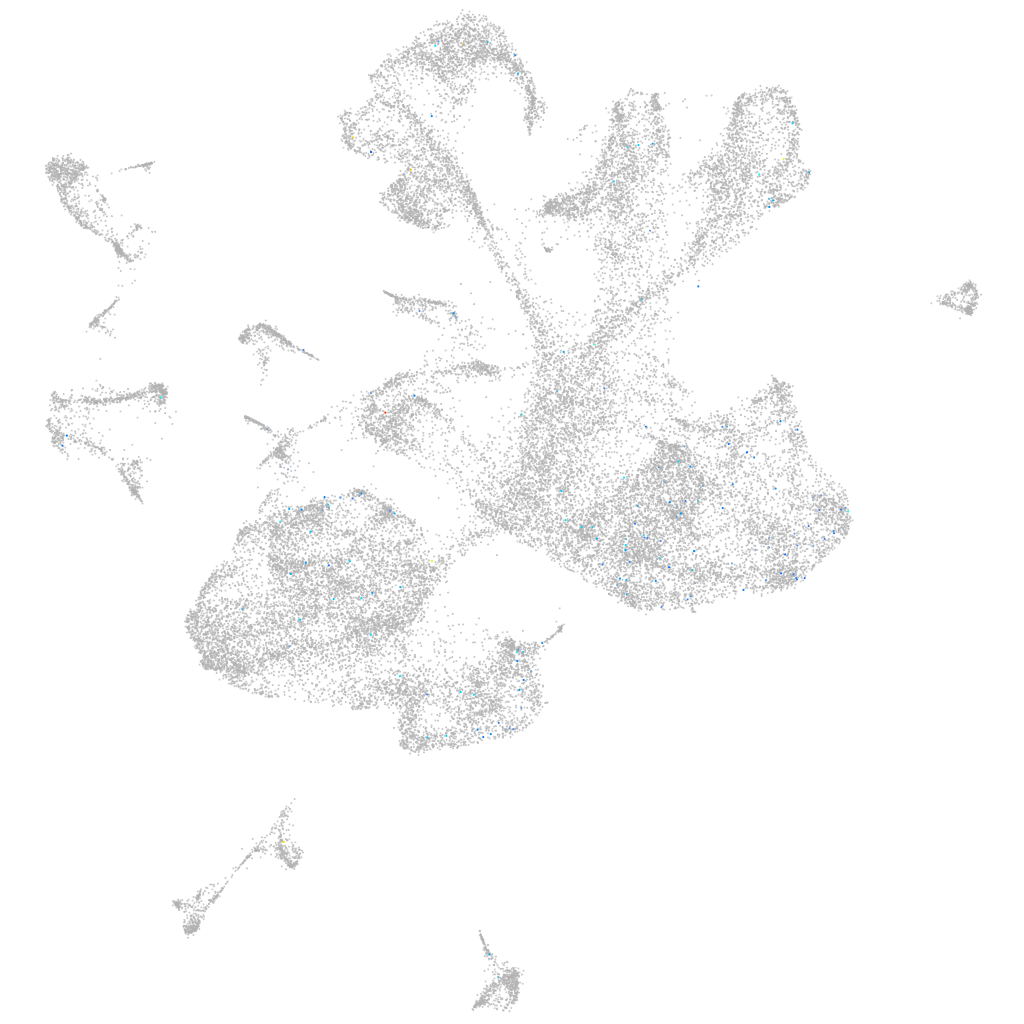
CABZ01043953.1.1 (glial cells / spinal cord)
Gene expression UMAP
Display:
Expression
Stage
Other cell groups
all cells
blastomeres
PGCs
endoderm
axial mesoderm
muscle
mural cells /
non-skeletal muscle
mesenchyme
hematopoietic /
vasculature
pronephros
neural
spinal cord / glia
eye
taste / olfactory
otic / lateral line
epidermis
periderm
fin
ionocytes / mucous
pigment cells
Expression by stage/cluster
Correlated gene expression
Positive correlation
Negative correlation
Gene
r
Gene
r
CT573423.1
0.108
si:ch211-260e23.9
-0.023
CU019562.2
0.099
pvalb1
-0.022
CR774194.1
0.095
syt11a
-0.019
mir20b
0.085
gabarapb
-0.019
or111-1
0.080
hbae3
-0.018
ifnlr1
0.080
tp53inp1
-0.017
LOC110439518
0.077
tnnt3b
-0.017
pimr201
0.077
ak1
-0.017
XLOC-031564
0.072
sesn1
-0.017
LOC101882433
0.069
npc2
-0.017
BX005012.1
0.069
actc1b
-0.016
LOC103910193
0.069
cx43
-0.016
XLOC-043976
0.068
glula
-0.016
AL935300.1
0.068
ndrg3a
-0.016
LOC101886743
0.068
tnni2a.4
-0.016
muc5f
0.062
si:ch211-66e2.5
-0.016
LOC103911809
0.061
tob1b
-0.016
si:dkey-1b17.5
0.057
hepacama
-0.016
LOC100538201
0.056
ptn
-0.015
slc6a19b
0.055
myhz1.1
-0.015
atg4db
0.052
emc7
-0.015
ora6
0.052
ndrg2
-0.015
myct1a
0.051
rnasekb
-0.015
CU138542.1
0.049
pvalb2
-0.015
blvra
0.048
efhd1
-0.015
LOC108181627
0.047
gapdhs
-0.015
fen1
0.046
map1ab
-0.014
LOC103909067
0.045
itm2ba
-0.014
si:dkey-182i3.9
0.045
adcyap1b
-0.014
XLOC-016974
0.044
ppdpfb
-0.014
BX088713.1
0.044
IGLON5
-0.014
rnf41l
0.043
sorbs1
-0.014
CU019663.1
0.042
dpysl3
-0.014
LOC110440101
0.042
proza
-0.014
pcna
0.042
smim29
-0.014