Daniocell
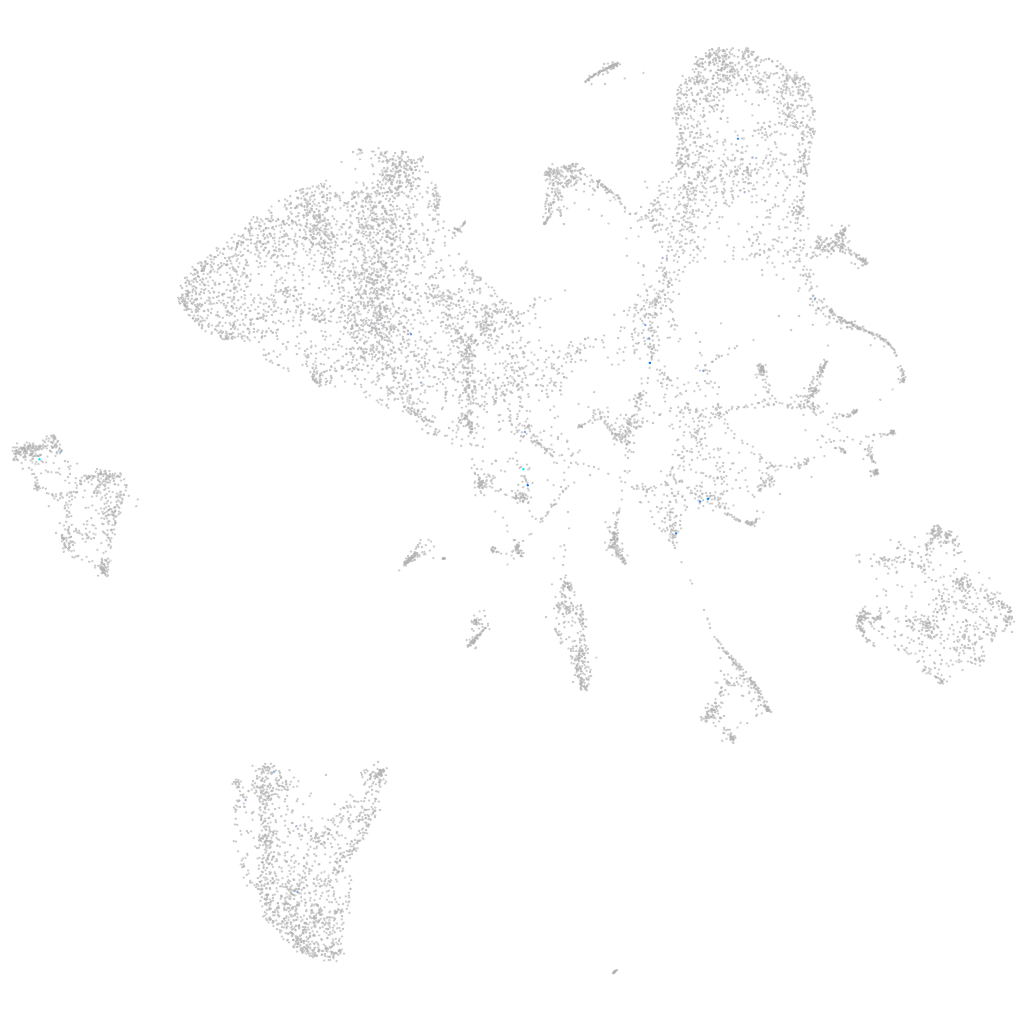
CABZ01043953.1.1 (endoderm)
Gene expression UMAP
Display:
Expression
Stage
Other cell groups
all cells
blastomeres
PGCs
endoderm
axial mesoderm
muscle
mural cells /
non-skeletal muscle
mesenchyme
hematopoietic /
vasculature
pronephros
neural
spinal cord / glia
eye
taste / olfactory
otic / lateral line
epidermis
periderm
fin
ionocytes / mucous
pigment cells
Expression by stage/cluster
Correlated gene expression
Positive correlation
Negative correlation
Gene
r
Gene
r
si:ch211-184m13.4
0.453
gatm
-0.023
BX511142.1
0.415
mid1ip1b
-0.023
cxcr3.1
0.317
rbp4
-0.022
valopa
0.303
gpx4a
-0.022
si:dkey-58f6.2
0.297
cebpd
-0.022
znf1067
0.295
tfa
-0.022
si:ch211-69b22.5
0.291
zgc:123103
-0.021
CABZ01092982.1
0.261
ces2
-0.021
si:dkey-16p6.2
0.220
grhprb
-0.021
LOC108181556
0.220
fabp10a
-0.021
arxb
0.214
gc
-0.021
BX537103.1
0.212
apom
-0.021
BX469902.1
0.201
rbp2b
-0.021
CABZ01030017.1
0.194
cpn1
-0.020
si:ch211-113a14.29
0.193
gamt
-0.020
igf1
0.191
bhmt
-0.020
XLOC-037388
0.189
pnp4b
-0.020
si:ch211-232m10.6
0.185
abat
-0.020
LOC101886711
0.182
hagh
-0.020
LOC110439585
0.178
agxtb
-0.020
LOC101885646
0.175
ttr
-0.020
LOC101885940
0.174
serpina1
-0.020
cnn1b
0.166
shbg
-0.020
XLOC-022245
0.161
rgrb
-0.020
kirrel3a
0.160
pgm1
-0.020
CABZ01066320.2
0.157
g6pca.2
-0.020
tbkbp1
0.156
tpi1b
-0.020
LOC110439849
0.152
apoc1
-0.020
si:dkey-3n22.9
0.151
LOC110437731
-0.020
BX511128.2
0.150
crp2
-0.020
adgre9
0.149
zgc:162730
-0.020
msh4
0.145
gpx3
-0.020
wdr47b
0.141
sat1a.2
-0.020
hist1h2a4.1
0.136
ambp
-0.019
si:dkey-7f16.3
0.135
cox5ab
-0.019