Daniocell
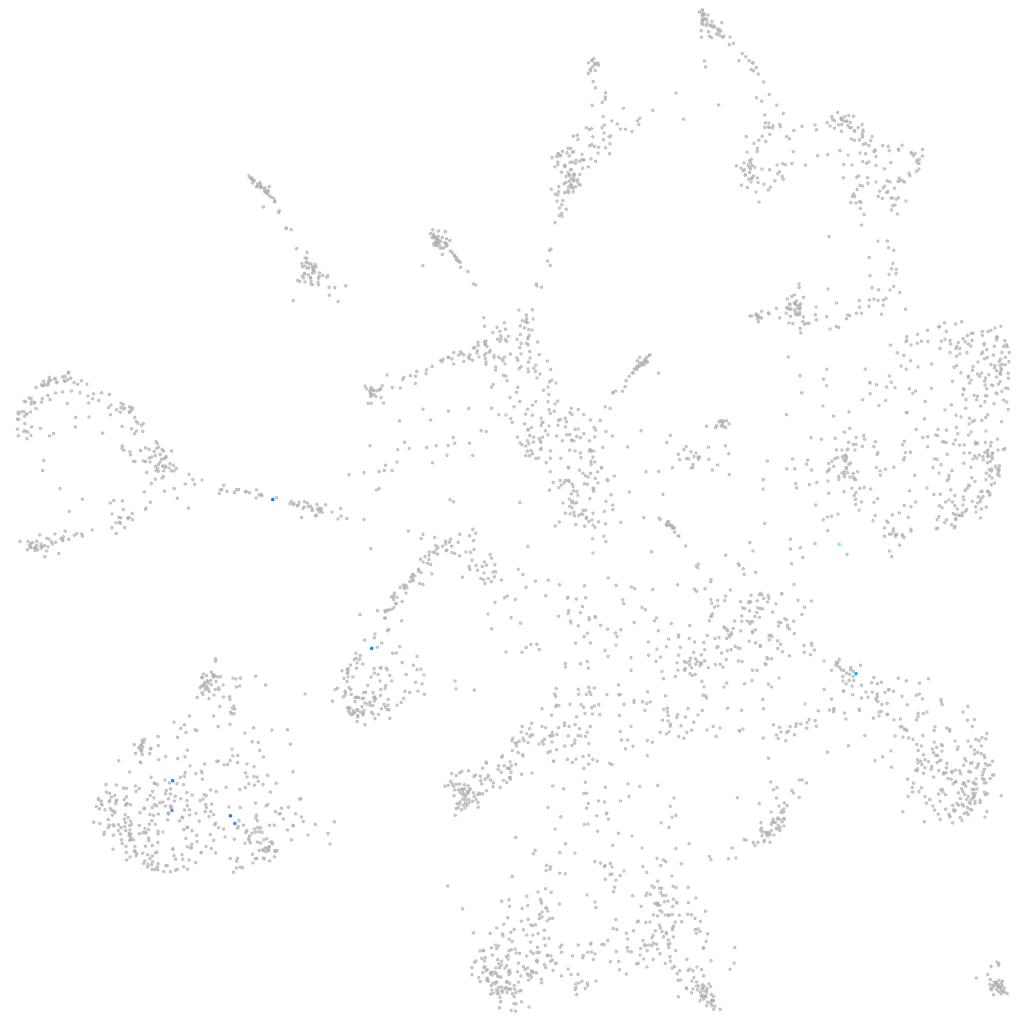
CABZ01043953.1.1 (mural cells / non-skeletal muscle)
Gene expression UMAP
Display:
Expression
Stage
Other cell groups
all cells
blastomeres
PGCs
endoderm
axial mesoderm
muscle
mural cells /
non-skeletal muscle
mesenchyme
hematopoietic /
vasculature
pronephros
neural
spinal cord / glia
eye
taste / olfactory
otic / lateral line
epidermis
periderm
fin
ionocytes / mucous
pigment cells
Expression by stage/cluster
Correlated gene expression
Positive correlation
Negative correlation
Gene
r
Gene
r
LOC103910799
0.614
krt18a.1
-0.039
tlr22
0.614
ubc
-0.035
LOC103910625
0.487
grinab
-0.034
FP102892.1
0.467
tmem176
-0.031
XLOC-042774
0.449
mcl1a
-0.030
si:ch73-194h10.2
0.417
tmem88b
-0.028
rpp25a
0.309
cavin1b
-0.027
si:ch211-162i14.1
0.306
etfb
-0.027
XLOC-031073
0.303
btf3l4
-0.026
CU929160.1
0.291
fthl27
-0.025
CR387921.1
0.290
mgst3b
-0.025
LOC108184022
0.290
COX5B
-0.025
rp1l1b
0.290
vaspb
-0.025
vwa5b2
0.290
ednraa
-0.024
LOC101883323
0.282
nrp1a
-0.024
XLOC-041451
0.271
rpz5
-0.023
pcdh2ab10
0.263
XLOC-044191
-0.023
CABZ01079818.1
0.247
pdhb
-0.023
si:ch211-243p7.3
0.242
col4a1
-0.023
LOC108179505
0.223
krt15
-0.023
paqr5b
0.212
lsp1
-0.023
flnbl
0.209
med10
-0.023
si:dkey-3p4.8
0.205
XLOC-041870
-0.022
LOC563477
0.198
pdcd6
-0.022
BX663525.2
0.192
bud31
-0.022
zgc:103681
0.188
rnf10
-0.022
CU655820.1
0.187
kctd12.2
-0.022
LOC100333534
0.186
fat1a
-0.022
si:dkey-11d20.1
0.184
hadhb
-0.022
AL928977.1
0.181
tspan4a
-0.021
ascl1a
0.178
anxa1a
-0.021
LOC100535067
0.173
tspan4b
-0.021
si:dkey-27n14.1
0.161
psap
-0.021
XLOC-035371
0.160
trappc5
-0.021
si:ch211-226m7.4
0.158
zgc:175088
-0.021