Daniocell
zgc:91944 (periderm)
zgc:91944
ZFIN
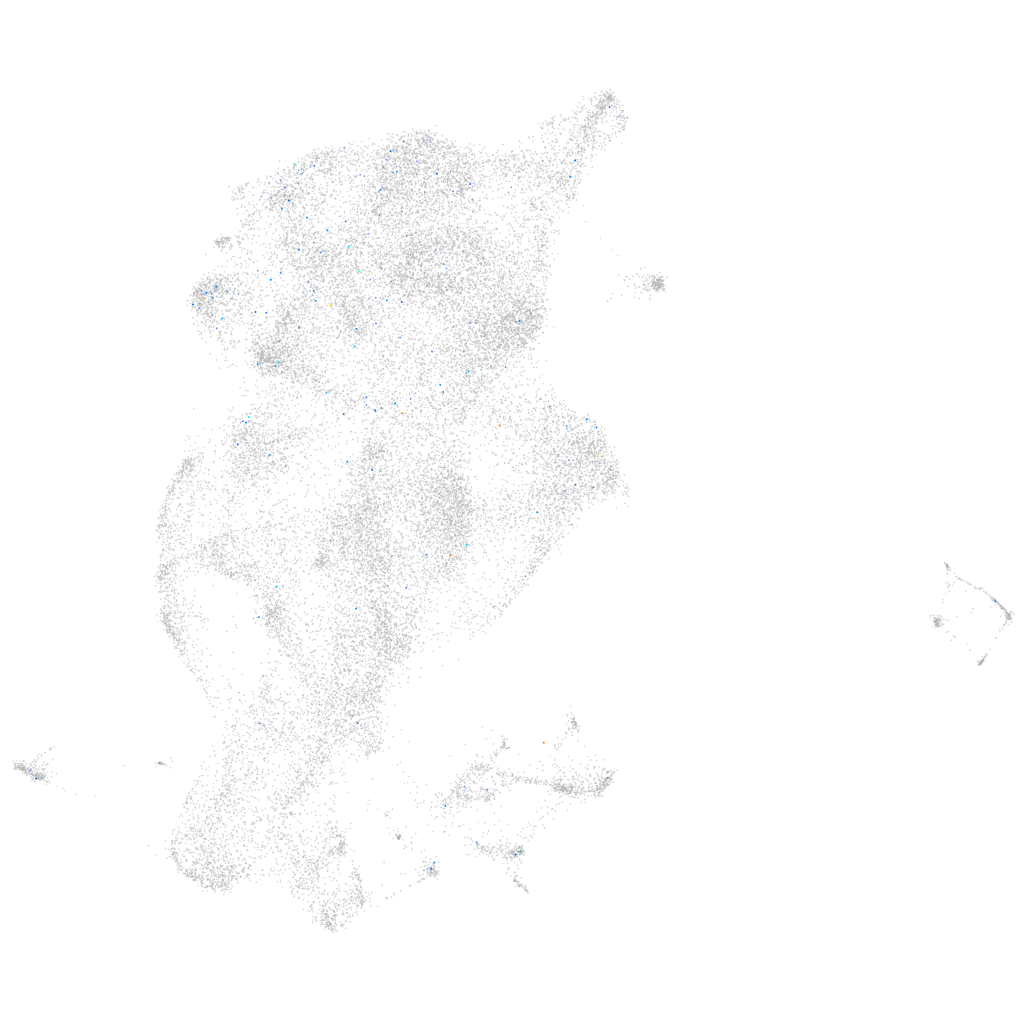
Gene expression UMAP
Display:
Expression
Stage
Other cell groups
all cells
blastomeres
PGCs
endoderm
axial mesoderm
muscle
mural cells /
non-skeletal muscle
mesenchyme
hematopoietic /
vasculature
pronephros
neural
spinal cord / glia
eye
taste / olfactory
otic / lateral line
epidermis
periderm
fin
ionocytes / mucous
pigment cells
Expression by stage/cluster
Correlated gene expression
Positive correlation
Negative correlation
Gene
r
Gene
r
sox8a
0.238
agr1
-0.047
LOC101882249
0.235
wu:fb18f06
-0.037
LOC101887108
0.228
cst14b.1
-0.037
CU929418.2
0.219
gsnb
-0.034
il23r
0.179
icn
-0.034
CR391910.2
0.162
cyt1l
-0.034
si:dkey-71h2.2
0.159
zgc:174938
-0.033
BX005392.1
0.148
tmsb1
-0.032
BX255897.1
0.147
ywhaz
-0.032
CR855277.2
0.143
si:ch211-195b11.3
-0.032
CR848715.1
0.133
ywhabl
-0.031
adamts17
0.133
zgc:175088
-0.030
crygm2d3
0.129
krt4
-0.029
hcn2b
0.125
icn2
-0.029
pex5lb
0.124
XLOC-041945
-0.029
ihha
0.115
zgc:193505
-0.029
si:dkeyp-92c9.2
0.110
gale
-0.028
emp3b
0.109
anxa1c
-0.028
vipr1b
0.109
ssr3
-0.027
calcoco1b
0.108
ANXA1 (1 of many)
-0.027
si:ch211-13f8.1
0.106
krt92
-0.027
snx25
0.105
capns1a
-0.027
tmigd1
0.104
ckap4
-0.027
si:dkey-217f16.6
0.103
tmem258
-0.027
si:dkeyp-72e1.7
0.103
xbp1
-0.027
BX927394.1
0.101
adh8b
-0.027
ftr13
0.101
capns1b
-0.026
si:ch211-121j5.4
0.101
dynll1
-0.026
eya4
0.100
cxcl14
-0.025
CABZ01034698.2
0.100
dad1
-0.025
CR377211.1
0.099
zgc:112964
-0.025
sv2ba
0.098
pim2
-0.024
atoh8
0.097
s100a10b
-0.024
si:dkey-88n24.5
0.096
capn9
-0.024
gucy2c
0.094
evplb
-0.024