Daniocell
zgc:91944 (mural cells / non-skeletal muscle)
zgc:91944
ZFIN
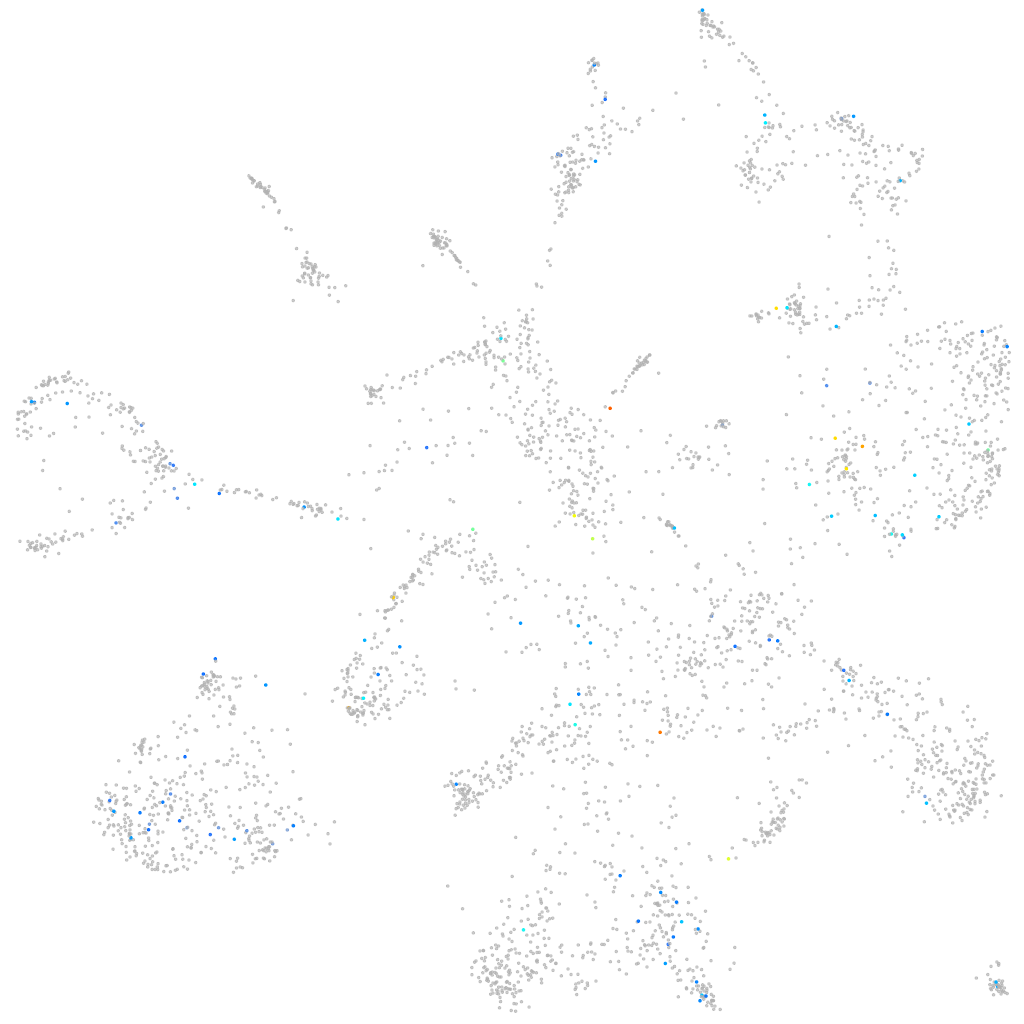
Gene expression UMAP
Display:
Expression
Stage
Other cell groups
all cells
blastomeres
PGCs
endoderm
axial mesoderm
muscle
mural cells /
non-skeletal muscle
mesenchyme
hematopoietic /
vasculature
pronephros
neural
spinal cord / glia
eye
taste / olfactory
otic / lateral line
epidermis
periderm
fin
ionocytes / mucous
pigment cells
Expression by stage/cluster
Correlated gene expression
Positive correlation
Negative correlation
Gene
r
Gene
r
gper1
0.223
krt18b
-0.052
si:ch211-85n16.4
0.186
mdka
-0.046
LOC101884156
0.166
fcho2
-0.042
XLOC-019674
0.160
rgs2
-0.040
zgc:173581
0.155
akirin1
-0.039
si:dkeyp-53e4.4
0.155
fis1
-0.039
BX682234.1
0.154
snrpf
-0.038
panx3
0.152
tpte
-0.038
si:dkey-58f6.2
0.147
hnrnpl
-0.037
LOC103912045
0.146
carm1
-0.037
XLOC-026582
0.141
kif1bp
-0.037
XLOC-001283
0.140
mapk14a
-0.036
FP236822.1
0.138
actb1
-0.036
ftr86
0.137
slc25a3b
-0.036
LOC108181107
0.136
serpine1
-0.035
snap23.2
0.134
etfa
-0.035
cyb5d1
0.130
dzip1
-0.035
si:dkey-189h5.6
0.128
h2afvb
-0.035
CR847887.1
0.127
cers5
-0.035
CR848788.2
0.124
si:dkeyp-69b9.6
-0.035
CU929379.1
0.124
nfyba
-0.035
esco1
0.122
arhgef12b
-0.034
gdf2
0.121
gtf2h4
-0.034
XLOC-031633
0.121
rbms2b
-0.034
si:ch73-206d17.1
0.120
si:rp71-45k5.4
-0.034
CU062431.1
0.119
hmgn7
-0.033
SH3RF3
0.117
si:ch73-281n10.2
-0.033
LOC101884173
0.115
myl9b
-0.033
znf1082
0.115
tuba8l
-0.033
XLOC-009861
0.115
pias4a
-0.033
fgf5
0.114
twist1a
-0.033
XLOC-043696
0.114
apbb1
-0.032
mau2
0.113
cops8
-0.032
pcnx2
0.112
eva1ba
-0.032
pwwp2a
0.112
flot2b
-0.032