Daniocell
zgc:91944 (taste / olfactory)
zgc:91944
ZFIN
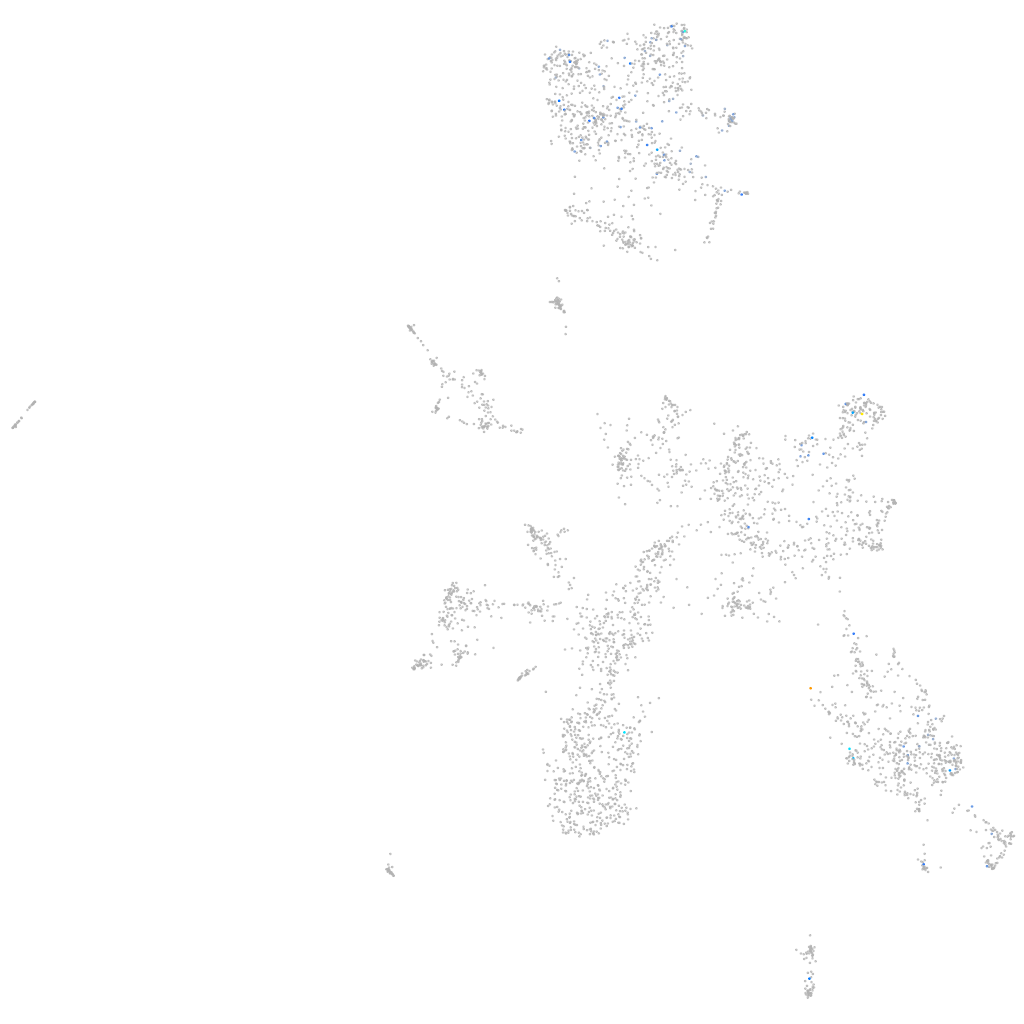
Gene expression UMAP
Display:
Expression
Stage
Other cell groups
all cells
blastomeres
PGCs
endoderm
axial mesoderm
muscle
mural cells /
non-skeletal muscle
mesenchyme
hematopoietic /
vasculature
pronephros
neural
spinal cord / glia
eye
taste / olfactory
otic / lateral line
epidermis
periderm
fin
ionocytes / mucous
pigment cells
Expression by stage/cluster
Correlated gene expression
Positive correlation
Negative correlation
Gene
r
Gene
r
si:dkey-4c15.14
0.447
elavl3
-0.076
XLOC-032543
0.447
stmn1b
-0.071
LOC108183700
0.352
rtn1a
-0.071
si:dkeyp-80d11.10
0.302
tmeff1b
-0.068
col27a1a
0.287
si:dkey-276j7.1
-0.068
LOC103909195
0.281
insm1a
-0.066
LOC101886275
0.274
cfl1
-0.064
XLOC-025473
0.266
atp6v0cb
-0.061
ftr64
0.262
tspan2a
-0.061
znf996
0.254
scg2b
-0.060
itih2
0.241
bcl11ba
-0.059
XLOC-035194
0.232
insm1b
-0.058
XLOC-042319
0.230
tuba1a
-0.058
ankha
0.228
zgc:65894
-0.057
znf1096
0.221
chga
-0.056
si:ch73-329n5.1
0.212
vdac3
-0.056
LOC103909118
0.198
sncb
-0.056
CABZ01058222.1
0.198
si:dkeyp-75h12.5
-0.056
zgc:64201
0.190
map1b
-0.055
pbld
0.190
pvalb5
-0.055
si:dkey-1j5.4
0.186
ptmab
-0.055
si:dkey-25i10.1
0.179
gng3
-0.054
klf4
0.177
adcyap1b
-0.053
sgms2b
0.171
LOC100537342
-0.052
si:ch73-352p4.8
0.171
dynlrb1
-0.052
slc12a4
0.169
hsbp1a
-0.052
XLOC-025051
0.168
gnal
-0.051
LO018605.3
0.167
si:ch73-1a9.3
-0.051
l3mbtl1b
0.163
ebf3a
-0.051
si:dkey-11f4.20
0.163
abhd2b
-0.051
uroc1
0.161
cox7c
-0.050
lgals3bpa
0.160
atf5a
-0.050
carmil1
0.159
nrsn1
-0.050
si:ch211-247j9.1
0.157
uncx
-0.049
FP015862.4
0.150
rnasekb
-0.049