Daniocell
zgc:91944 (endoderm)
zgc:91944
ZFIN
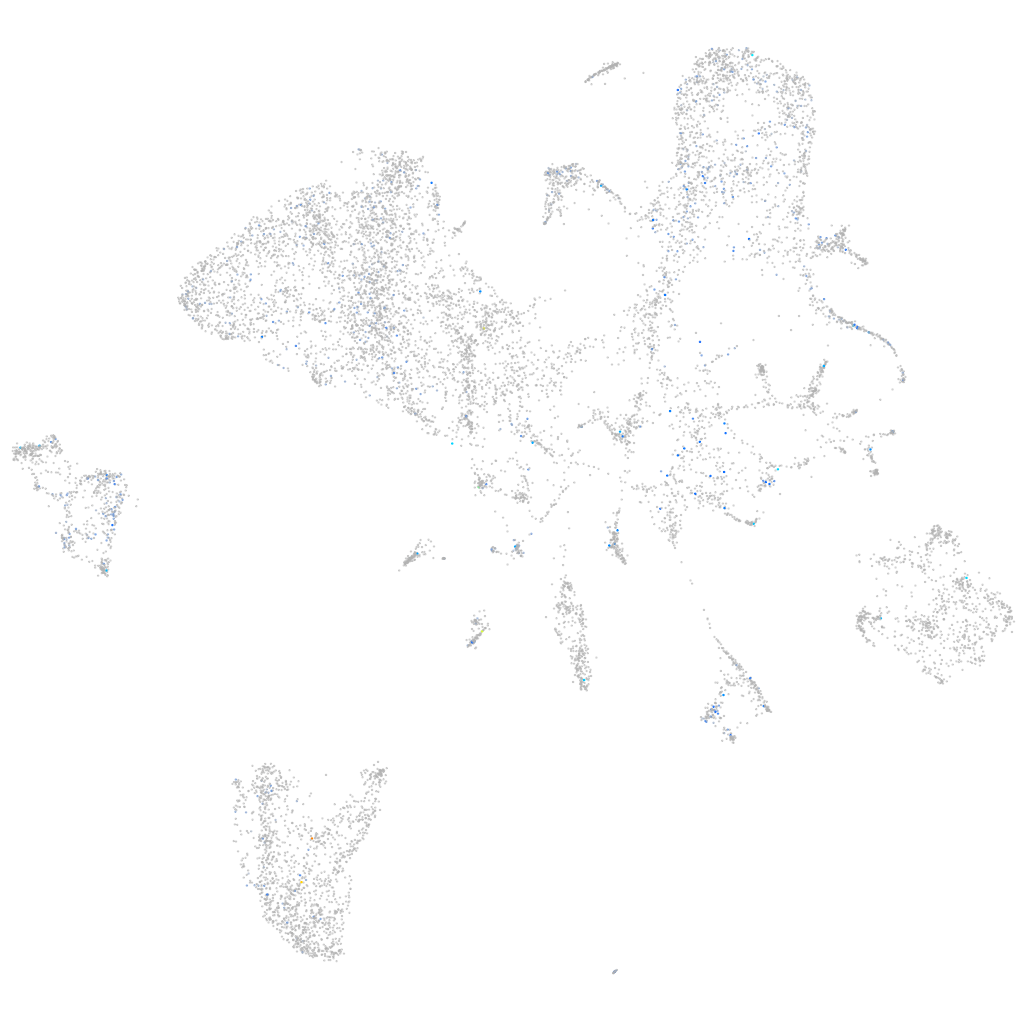
Gene expression UMAP
Display:
Expression
Stage
Other cell groups
all cells
blastomeres
PGCs
endoderm
axial mesoderm
muscle
mural cells /
non-skeletal muscle
mesenchyme
hematopoietic /
vasculature
pronephros
neural
spinal cord / glia
eye
taste / olfactory
otic / lateral line
epidermis
periderm
fin
ionocytes / mucous
pigment cells
Expression by stage/cluster
Correlated gene expression
Positive correlation
Negative correlation
Gene
r
Gene
r
lim2.2
0.180
apoc1
-0.043
LOC101883656
0.167
bhmt
-0.042
si:ch211-175f12.2
0.159
aqp12
-0.041
sh2d1ab
0.158
cpa1
-0.039
panx2
0.140
endou
-0.038
stxbp1b
0.140
pla2g1b
-0.037
znf1140
0.131
gatm
-0.036
LOC110438441
0.127
apoda.2
-0.035
XLOC-003903
0.127
agxtb
-0.035
BX649490.3
0.118
si:ch211-240l19.6
-0.034
gsg1l2a
0.118
cel.2
-0.033
si:ch211-234h8.7
0.117
ssr1
-0.033
LOC108180041
0.112
ppdpfa
-0.033
LOC100333474
0.112
sox17
-0.032
vstm4a
0.111
tbx16
-0.032
fam20ca
0.105
cbsb
-0.032
LOC108181651
0.104
zgc:123103
-0.032
CABZ01092907.1
0.104
si:dkey-266f7.9
-0.031
LO017643.1
0.104
cdh2
-0.031
syt1b
0.101
zgc:136461
-0.031
CABZ01092282.1
0.101
ces2
-0.031
cacng7b
0.099
fgg
-0.031
BX511034.5
0.099
si:ch73-44m9.5
-0.031
wdr41
0.099
si:ch211-152c2.3
-0.031
pou4f3
0.098
marcksb
-0.031
si:ch211-281p14.2
0.098
serpina1l
-0.031
LOC108190390
0.097
COX7A2
-0.030
si:dkey-34d22.2
0.096
si:ch211-137a8.4
-0.030
DGKI
0.095
prss59.1
-0.030
epn3b
0.095
LOC108190024
-0.030
AL928908.3
0.094
ela2l
-0.030
LOC100150670
0.093
c6ast4
-0.030
gng8
0.093
c9
-0.030
chrna6
0.092
tp53inp2
-0.030
ifitm5
0.092
fetub
-0.030