Daniocell
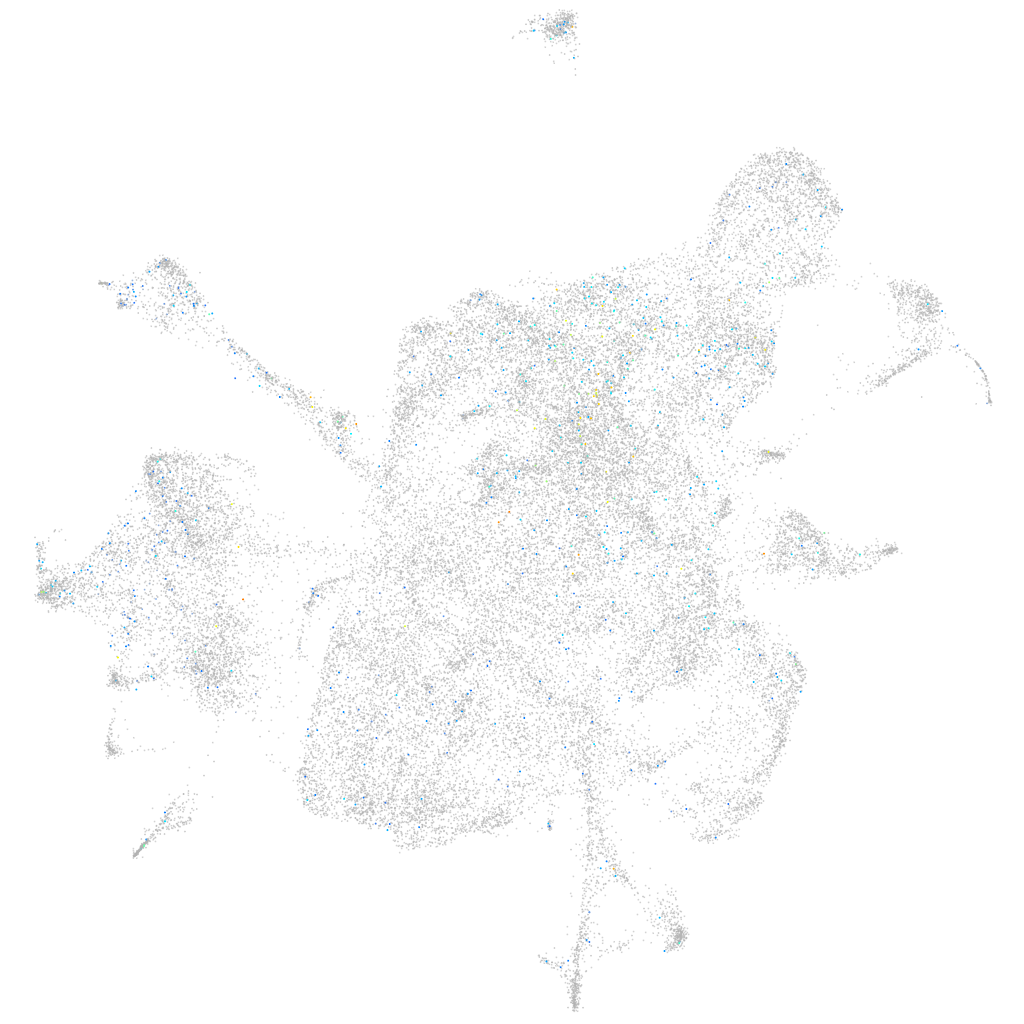
zgc:91944 (mesenchyme)
zgc:91944
ZFIN
Gene expression UMAP
Display:
Expression
Stage
Other cell groups
all cells
blastomeres
PGCs
endoderm
axial mesoderm
muscle
mural cells /
non-skeletal muscle
mesenchyme
hematopoietic /
vasculature
pronephros
neural
spinal cord / glia
eye
taste / olfactory
otic / lateral line
epidermis
periderm
fin
ionocytes / mucous
pigment cells
Expression by stage/cluster
Correlated gene expression
Positive correlation
Negative correlation
Gene
r
Gene
r
LOC100330380
0.073
hmga1a
-0.040
XLOC-004014
0.072
h2afvb
-0.033
si:ch211-165f21.4
0.061
snrpf
-0.032
si:dkey-85k15.11
0.060
hmgb2a
-0.031
si:ch211-218m3.19
0.060
si:ch73-281n10.2
-0.031
LOC100333926
0.057
tubb2b
-0.031
AL929105.1
0.057
fabp3
-0.030
ifit8
0.052
snrpb
-0.030
LOC110438467
0.050
lin28a
-0.030
si:dkey-12l12.1
0.050
snrpe
-0.029
MYO1G
0.050
apex1
-0.029
defbl2
0.048
rplp2l
-0.028
FO393424.1
0.047
prmt1
-0.028
si:ch73-359m17.11
0.047
snrpg
-0.028
LOC110439954
0.046
snrpd1
-0.028
LOC103910947
0.046
si:dkey-151g10.6
-0.028
col6a3
0.044
golt1bb
-0.027
olfml3b
0.044
magoh
-0.027
ogna
0.044
cdc20
-0.027
si:ch211-230g14.3
0.044
hnrnpabb
-0.027
socs3a
0.044
hnrnpa0b
-0.027
ctgfb
0.044
marcksb
-0.027
BX005156.2
0.044
hmgb2b
-0.026
zgc:158260
0.043
nucks1a
-0.026
AL929309.1
0.043
snrpd2
-0.026
zgc:162730
0.042
ube2c
-0.025
sparc
0.042
si:ch211-222l21.1
-0.025
LOC110437844
0.042
tuba1b
-0.025
BX088587.1
0.041
tma7
-0.025
BX004785.2
0.041
stmn1a
-0.025
mxra8b
0.041
tram1
-0.025
wfdc2
0.040
cirbpb
-0.024
nfic
0.040
seta
-0.024
BX908726.1
0.040
ddx39ab
-0.024
ppdpfb
0.040
khdrbs1a
-0.024