Daniocell
zgc:162962 (mesenchyme)
zgc:162962
ZFIN
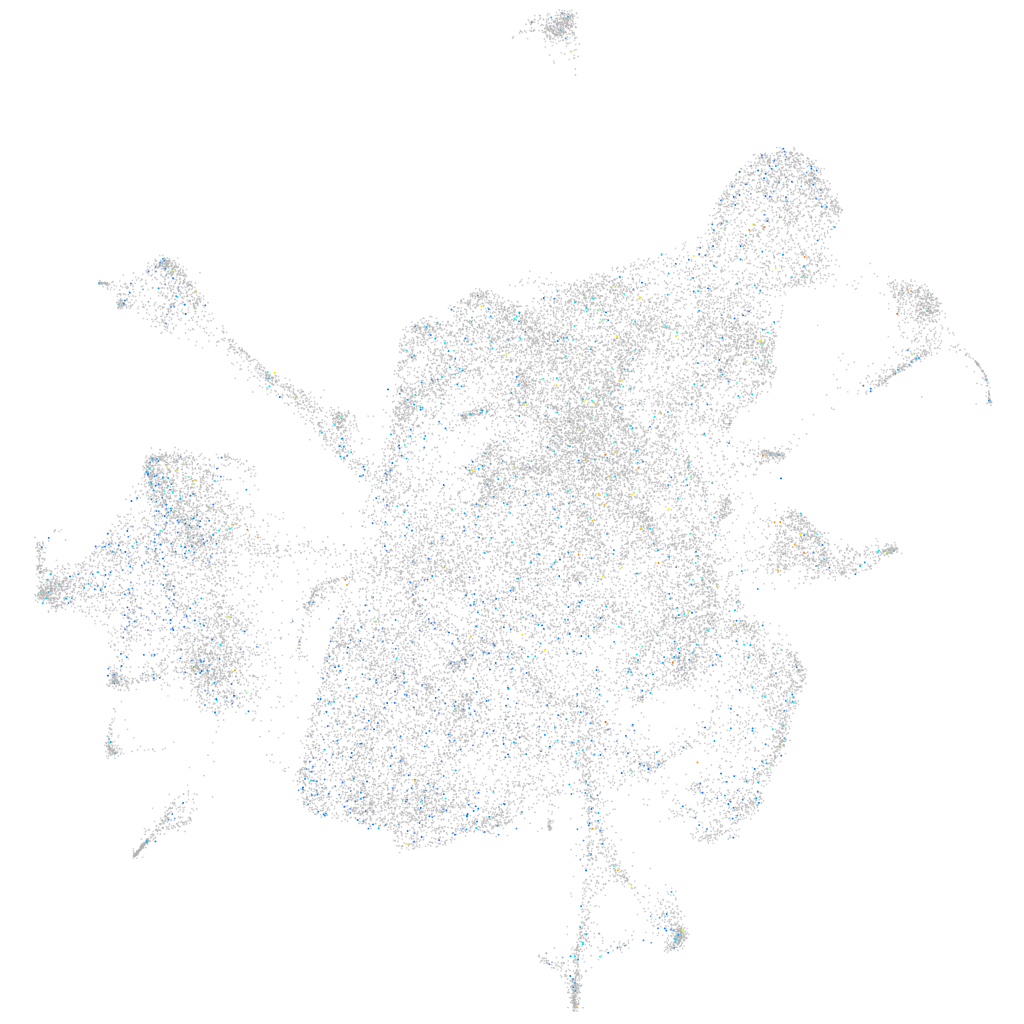
Gene expression UMAP
Display:
Expression
Stage
Other cell groups
all cells
blastomeres
PGCs
endoderm
axial mesoderm
muscle
mural cells /
non-skeletal muscle
mesenchyme
hematopoietic /
vasculature
pronephros
neural
spinal cord / glia
eye
taste / olfactory
otic / lateral line
epidermis
periderm
fin
ionocytes / mucous
pigment cells
Expression by stage/cluster
Correlated gene expression
Positive correlation
Negative correlation
Gene
r
Gene
r
LOC110439517
0.070
rplp2
-0.018
XLOC-043449
0.054
rpl37
-0.017
XLOC-031563
0.051
rps29
-0.017
XLOC-036513
0.049
BX640522.2
-0.016
BX296520.1
0.048
rpl38
-0.015
CU652528.1
0.047
uba52
-0.014
si:dkey-181m19.17
0.043
krt92
-0.014
si:ch211-264e16.2
0.042
si:ch211-194b1.1
-0.013
zgc:162999
0.041
rplp1
-0.013
XLOC-031233
0.041
rpl29
-0.013
si:ch73-262h23.4
0.040
gnat2
-0.013
BX469908.1
0.040
nat14
-0.012
tgm1l4
0.039
spsb4b
-0.012
si:ch211-167j6.5
0.039
zgc:163080
-0.012
BX324006.1
0.038
rps21
-0.012
si:ch1073-209h18.1
0.038
rpl23a
-0.012
tfr1a
0.037
rgs5a
-0.011
CR382334.1
0.036
rpl39
-0.011
si:dkey-98j1.5
0.036
znf1148
-0.011
sid1
0.035
opn1lw2
-0.011
CABZ01072487.2
0.035
XLOC-011916
-0.011
irf4b
0.035
wu:fj64h06
-0.011
shisa6
0.035
pamr1
-0.011
XLOC-002710
0.034
s100t
-0.011
XLOC-018236
0.033
zgc:92749
-0.011
si:dkey-83f18.6
0.032
serpina1
-0.011
pimr110
0.032
mir214a
-0.011
hs3st4
0.032
ppil4
-0.011
BX004996.1
0.031
hbae3
-0.011
atp1a1a.1
0.031
rcor3
-0.011
pimr63
0.031
si:ch1073-459b3.2
-0.011
slc9a2
0.031
hemgn
-0.011
ovol1a
0.031
gngt1
-0.011
CU469420.4
0.030
slc51a
-0.011
FO834828.1
0.030
top1
-0.011