Daniocell
zgc:162962 (endoderm)
zgc:162962
ZFIN
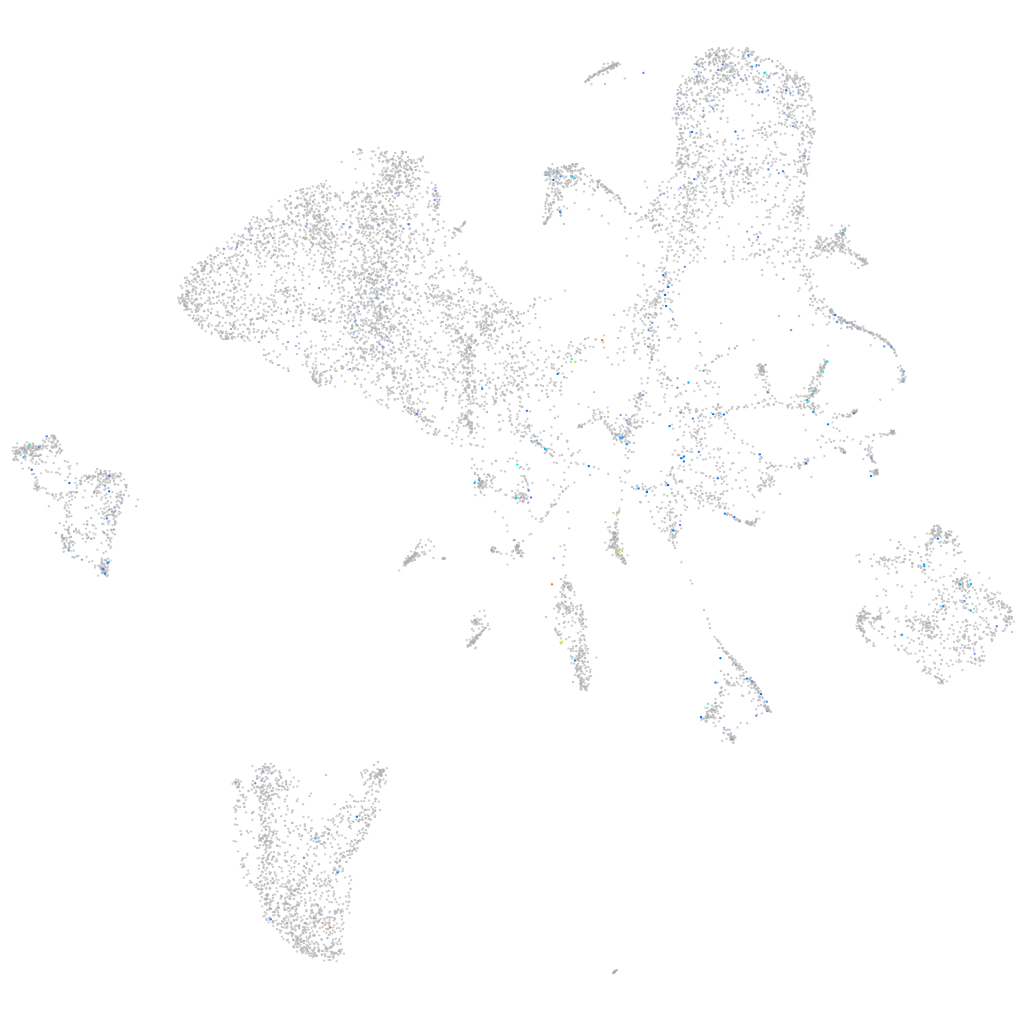
Gene expression UMAP
Display:
Expression
Stage
Other cell groups
all cells
blastomeres
PGCs
endoderm
axial mesoderm
muscle
mural cells /
non-skeletal muscle
mesenchyme
hematopoietic /
vasculature
pronephros
neural
spinal cord / glia
eye
taste / olfactory
otic / lateral line
epidermis
periderm
fin
ionocytes / mucous
pigment cells
Expression by stage/cluster
Correlated gene expression
Positive correlation
Negative correlation
Gene
r
Gene
r
BX323801.1
0.238
bhmt
-0.066
LOC110440045
0.229
agxtb
-0.064
obsl1b
0.166
mat1a
-0.063
wu:fd14a01.1
0.152
ttr
-0.057
adgrf6
0.144
gatm
-0.056
CR388079.2
0.133
ahcy
-0.056
si:dkey-83f18.8
0.130
ces2
-0.056
si:dkey-28d5.9
0.130
LOC110437731
-0.056
si:ch211-63p21.4
0.129
apom
-0.055
LOC101884197
0.122
ttc36
-0.055
si:dkey-83f18.10
0.119
grhprb
-0.055
CABZ01087091.1
0.117
agxta
-0.055
si:dkey-7i4.11
0.111
fabp10a
-0.055
znf831
0.111
kng1
-0.055
XLOC-000357
0.110
hpda
-0.055
smpdl3a
0.110
serpina1l
-0.055
LOC101885738
0.110
fgb
-0.054
si:ch211-276a17.5
0.109
fgg
-0.054
LOC103910179
0.108
serpina1
-0.054
LOC103909610
0.108
hao1
-0.054
sulf2a
0.108
si:dkey-86l18.10
-0.054
AL831726.3
0.107
rbp2b
-0.053
CU570881.2
0.106
ambp
-0.053
CABZ01041962.1
0.105
uox
-0.053
isg15
0.105
apoa2
-0.052
XLOC-010131
0.104
cdab
-0.052
CABZ01053592.1
0.103
fga
-0.052
LOC108190036
0.103
shbg
-0.052
CT583728.26
0.102
itih2
-0.052
znf975
0.098
comtd1
-0.052
CABZ01112025.1
0.098
si:ch73-361h17.1
-0.051
BX649411.2
0.098
gc
-0.051
npas2
0.097
zgc:123103
-0.051
si:dkey-19b23.14
0.097
aqp12
-0.051
BX908780.1
0.096
apoc1
-0.051