Daniocell
zgc:162962 (glial cells / spinal cord)
zgc:162962
ZFIN
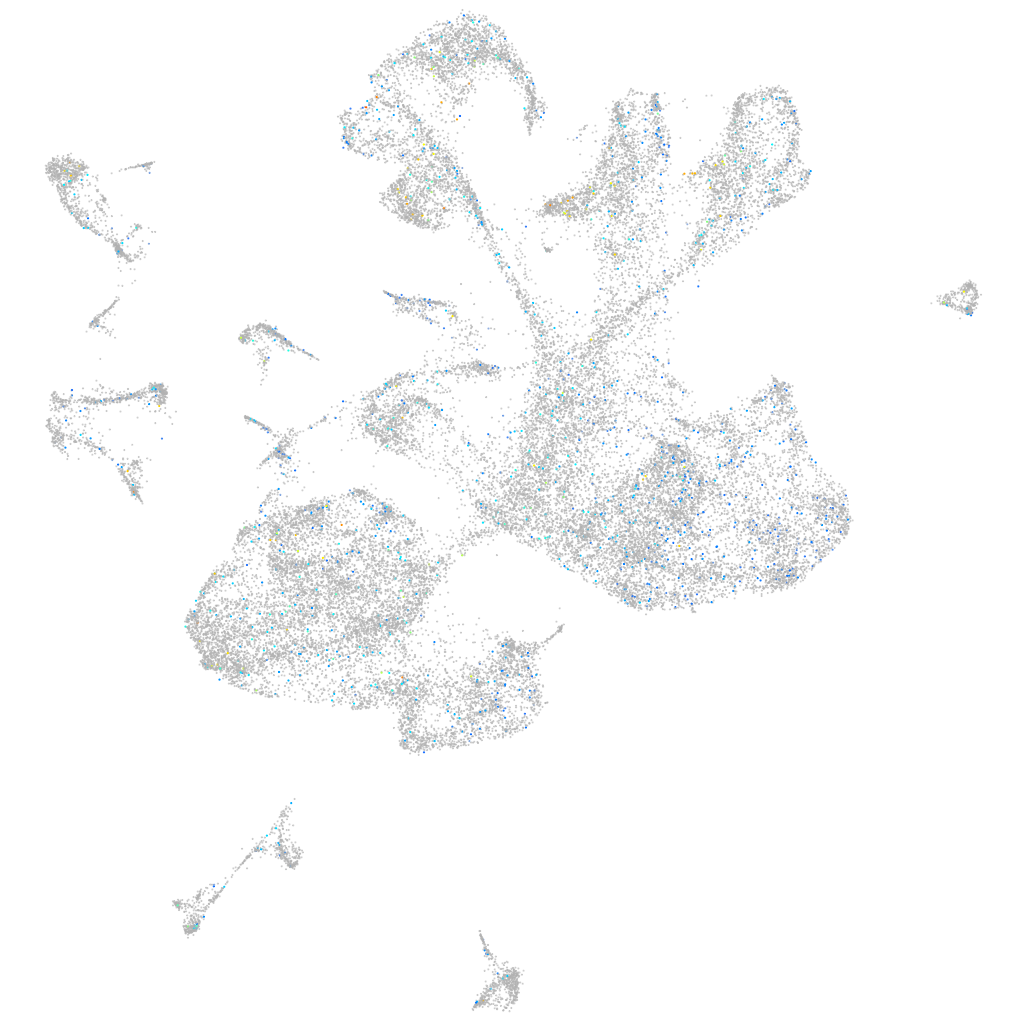
Gene expression UMAP
Display:
Expression
Stage
Other cell groups
all cells
blastomeres
PGCs
endoderm
axial mesoderm
muscle
mural cells /
non-skeletal muscle
mesenchyme
hematopoietic /
vasculature
pronephros
neural
spinal cord / glia
eye
taste / olfactory
otic / lateral line
epidermis
periderm
fin
ionocytes / mucous
pigment cells
Expression by stage/cluster
Correlated gene expression
Positive correlation
Negative correlation
Gene
r
Gene
r
BX323830.1
0.056
her13
-0.017
or132-5
0.055
BX530077.1
-0.017
CR377229.1
0.052
gapdh
-0.016
CR944667.3
0.051
mcm2
-0.015
CU469584.1
0.047
zc3h7bb
-0.015
XLOC-011873
0.046
BX004769.1
-0.015
CR450813.1
0.044
nr5a2
-0.014
LOC108190059.1
0.044
cdc25b
-0.014
LOC108179692
0.043
esm1
-0.014
myh6
0.042
ptbp1b
-0.014
BX005024.1
0.042
cdca7a
-0.014
fgf19
0.042
im:7152348
-0.014
CABZ01068244.1
0.041
gadd45gb.1
-0.013
si:dkeyp-3f10.16
0.041
dbx1a
-0.013
rspo4
0.041
dclk1a
-0.013
slc39a4
0.040
eif4ebp3
-0.013
tnfsf11
0.039
sptlc1
-0.013
si:ch211-250m6.7
0.038
dph3
-0.013
si:cabz01068815.1
0.037
si:ch211-193l2.6
-0.012
cxcr3.1
0.037
serpinb14
-0.012
CABZ01045414.1
0.037
ASS1
-0.012
LOC101885717
0.035
trim62
-0.012
CABZ01102517.1
0.035
emg1
-0.012
zgc:194242
0.035
si:ch211-22d5.2
-0.012
FP016142.4
0.034
rps29
-0.012
fer1l4
0.034
ifi30
-0.012
LOC110438488
0.034
rhoj
-0.012
BX927121.1
0.034
fxr1
-0.012
CU570782.2
0.034
her15.1
-0.012
pcdh1g26
0.033
fstl1a
-0.012
si:ch211-38m6.7
0.033
tead1a
-0.012
LOC103910804
0.033
notch1a
-0.012
BX293559.2
0.033
sf3b4
-0.012
LOC100537147
0.032
znf628
-0.012
si:dkey-21e2.7
0.032
sfxn4
-0.012