Daniocell
zgc:162962 (pigment cells)
zgc:162962
ZFIN
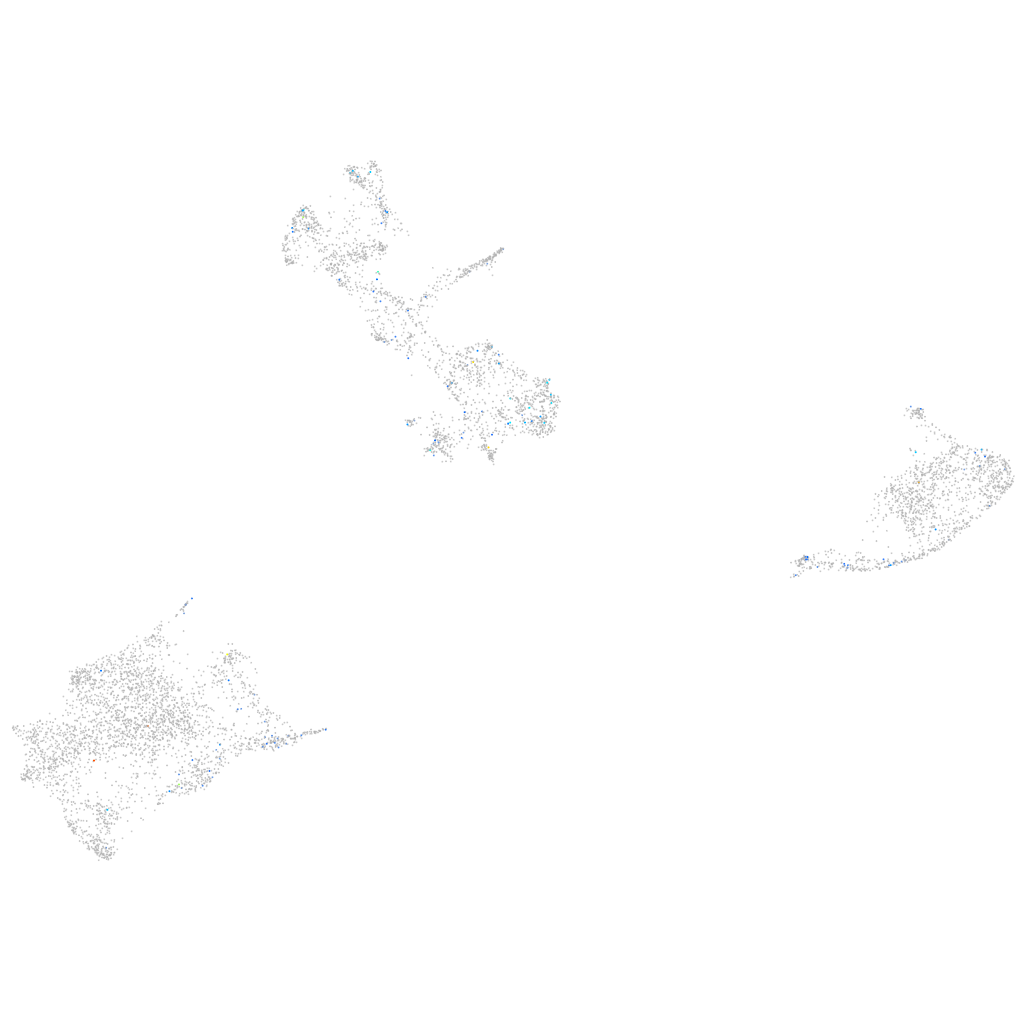
Gene expression UMAP
Display:
Expression
Stage
Other cell groups
all cells
blastomeres
PGCs
endoderm
axial mesoderm
muscle
mural cells /
non-skeletal muscle
mesenchyme
hematopoietic /
vasculature
pronephros
neural
spinal cord / glia
eye
taste / olfactory
otic / lateral line
epidermis
periderm
fin
ionocytes / mucous
pigment cells
Expression by stage/cluster
Correlated gene expression
Positive correlation
Negative correlation
Gene
r
Gene
r
ftr04
0.282
si:dkey-251i10.2
-0.043
XLOC-011687
0.200
pvalb1
-0.039
RF01277
0.198
pvalb2
-0.039
LOC108181458
0.185
gstp1
-0.038
CABZ01078733.1
0.180
hbbe1.3
-0.036
FP236809.1
0.162
zgc:110339
-0.034
si:dkey-16n15.6
0.161
uraha
-0.034
LOC110439440
0.159
hbbe1.2
-0.033
si:dkey-48g21.7
0.148
gch2
-0.033
si:ch1073-390k14.1
0.146
actb2
-0.032
si:ch211-160b11.4
0.144
actc1b
-0.032
LOC110438029
0.140
tmem130
-0.032
xcr1b.3
0.140
reep5
-0.031
si:ch211-117n7.7
0.140
oacyl
-0.031
ddx43
0.138
CABZ01021592.1
-0.030
LOC795766
0.136
slc22a7a
-0.030
si:ch211-1i11.3
0.135
krt4
-0.029
si:dkey-65b13.13
0.134
myl1
-0.029
LOC103908820
0.132
prdx1
-0.029
LOC108181595
0.132
pfn2
-0.028
zmp:0000001301
0.130
pts
-0.028
XLOC-019038
0.130
hbae3
-0.028
march1
0.129
tnni2a.4
-0.028
XLOC-043931
0.126
anxa5b
-0.028
rab44
0.123
hbbe1.1
-0.028
tlr8b
0.123
bco1
-0.027
BX323450.1
0.121
mylpfa
-0.026
ptafr
0.120
si:ch211-251b21.1
-0.026
si:ch73-233f7.7
0.120
tpma
-0.026
BX005380.1
0.119
aldob
-0.026
si:ch211-205a14.7
0.116
cyt1
-0.026
LOC793648
0.115
tnnc2
-0.025
tmem79a
0.115
rtn1b
-0.025
anos1b
0.113
mdh1aa
-0.025
LOC103909513
0.112
s100a10b
-0.025