Daniocell
zgc:162962 (taste / olfactory)
zgc:162962
ZFIN
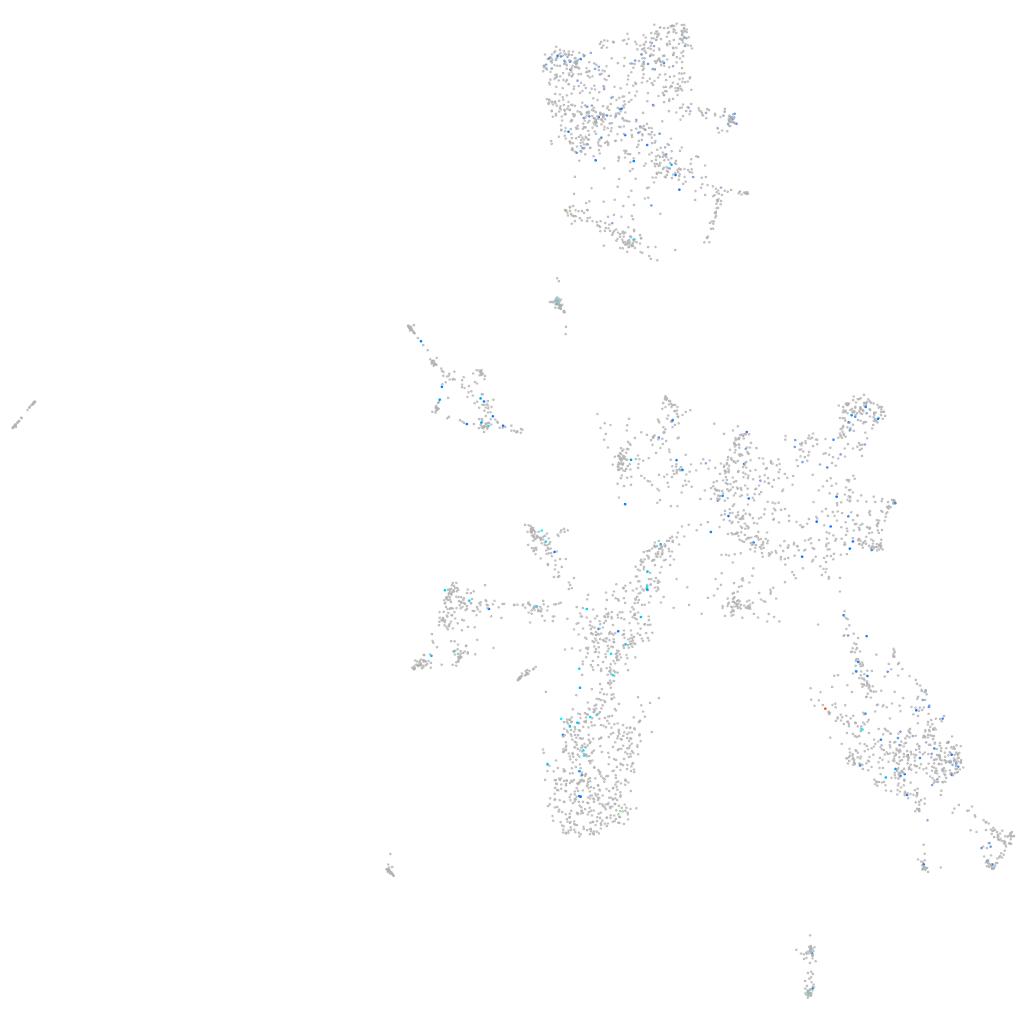
Gene expression UMAP
Display:
Expression
Stage
Other cell groups
all cells
blastomeres
PGCs
endoderm
axial mesoderm
muscle
mural cells /
non-skeletal muscle
mesenchyme
hematopoietic /
vasculature
pronephros
neural
spinal cord / glia
eye
taste / olfactory
otic / lateral line
epidermis
periderm
fin
ionocytes / mucous
pigment cells
Expression by stage/cluster
Correlated gene expression
Positive correlation
Negative correlation
Gene
r
Gene
r
FQ311879.1
0.264
msl2b
-0.039
FO904898.4
0.163
usp42
-0.039
LOC108179116
0.155
med18
-0.038
zar1l
0.144
mesd
-0.037
CR387919.1
0.140
hikeshi
-0.037
LOC110439428
0.135
cox15
-0.036
BX890548.1
0.129
fxr2
-0.036
tmem41ab
0.126
ttc5
-0.034
XLOC-036506
0.124
CU638714.1
-0.034
LO018315.7
0.121
kcnn3
-0.033
LOC103909543
0.120
ecpas
-0.033
AL935115.1
0.120
cc2d2a
-0.033
fgd5b
0.120
tmem9b
-0.033
LOC101885454
0.119
grwd1
-0.033
LOC101882892
0.117
pard3ab
-0.033
ankha
0.115
ubl3b
-0.032
FO393424.2
0.114
enah
-0.032
XLOC-027892
0.114
derl1
-0.032
ighd
0.114
ago3b
-0.032
si:ch1073-416d2.3
0.110
strn3
-0.032
fam149a
0.110
snx9b
-0.032
LOC108183599
0.109
bcam
-0.032
LOC100537163
0.109
rpl6
-0.032
LOC101884504
0.106
rnf145a
-0.032
si:dkey-7k24.5
0.106
ttl
-0.032
AL831745.1
0.105
zgc:112982
-0.032
si:ch211-173a9.6
0.104
chm
-0.031
LOC793449
0.102
nrg1
-0.031
si:dkeyp-94g1.1
0.102
mrpl1
-0.031
XLOC-007145
0.100
hsp90b1
-0.031
LOC101885809
0.099
tnfaip3
-0.031
pgm2
0.099
kif1bp
-0.031
CABZ01072309.2
0.098
usp40
-0.031
alpk3a
0.097
psat1
-0.031
BX897691.1
0.096
CABZ01077218.1
-0.031